
Two Stingy Stocks For 2018
 The list of Stingy Stocks got its start in the Canadian MoneySaver just after the turn of the century. The idea was to try to beat the S&P 500 by picking value stocks from within the index itself using a numbers-based approach.
The results have exceeded my expectations and last year was a particularly good one. The Stingy Stocks gained 58.3% on average since my last update. By way of comparison the S&P 500 (as represented by the SPY exchange traded fund) trailed far behind with an advance of 22.0% over the same period. The Stingy Stocks beat the index by 36.3 percentage points. Not bad, if I do say so myself.
While the recent returns have been phenomenal, they represent the third best showing for the Stingy Stocks. This year’s gains were exceeded by back-to-back returns of more than 60% in the years just after the crash of 2008.
Over the long term the Stingy Stocks gained an average of 15.8% per year since the end of 2001. By way of comparison, the S&P 500 (as represented by the SPY exchange traded fund) climbed 7.4% per year over the same period. The Stingy Stocks outperformed the index by an average of 8.4 percentage points annually.
To put that into perspective. If you had split $100,000 equally among the original Stingy Stocks at the end of 2001 and moved into the new stocks each year, your portfolio would now be worth more than $1,038,000 – or more than 10 times your original investment. You can see the full performance record in the accompanying table. (I hope you’ll excuse me for not including commissions and other trading frictions in these figures because they vary depending on the investor.)
It is important to remember that the method has had its ups and downs over the years. It is not a guaranteed path to success. Investors who follow it should be prepared to take the good with the bad.
When hunting for Stingy Stocks I look for companies that are cheap compared to their fundamentals and relatively safe.
On the value front, I like stocks that trade at price-to-sales ratios of less than one. Typically only a few pass the test and this year was no exception.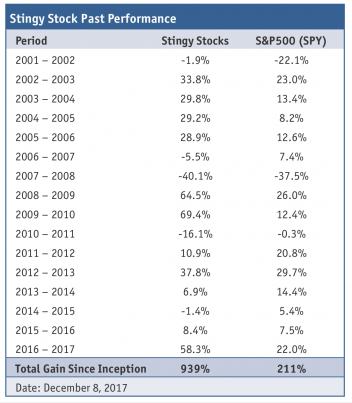
Cheap stocks are great but I also want some assurance they won’t go bust. The firms in the S&P 500 tend to be large and relatively stable compared to smaller firms. But, because size is an insufficient measure of safety, I also look for companies with little debt and lots of assets. Such firms are stronger than those perched on mountains of debt.
Three ratios are useful when looking for companies with little debt. A touchstone is the debt-to-equity ratio which is calculated by dividing a company’s debt by its shareholders' equity. The amount of debt that a company can comfortably support varies from industry to industry. I prefer conservative companies with debt-to-equity ratios of 0.5 or less.
The next balance sheet figure to consider is the current ratio which is calculated by dividing a company’s current assets by its current liabilities. Current assets are assets, such as receivables and inventory, that can be turned into cash within the next year. Current liabilities are payments that a company must make over the next year. Naturally, an investor would like a company’s current assets to be much more than its current liabilities. After all, you can be pretty sure that a firm’s creditors will demand prompt payment of the current liabilities. On the other hand, some current assets, such as inventory, might not turn out to be worth as much as expected. I prefer conservative companies with current assets at least twice as large as current liabilities.
Finally, a company’s earnings before interest and taxes should be large in comparison to its interest payments. The ratio of earnings-before-interest-and-taxes to interest-payments is called interest coverage and I like this ratio to be at least two or more.
The debt ratios I’ve selected are useful in determining a firm’s ability to shoulder debt, but they are not perfect. For instance, some obligations may not be fully reflected on a company’s balance sheet and are, sensibly enough, called off-balance sheet debts. They can be a source of considerable trouble. That’s why, as with all screening techniques, you should embark on a more detailed investigation of each stock before making a final investment decision.
Continuing the safety theme, I also want a company to show some earnings and cash flow from operations over the last year. After all, a business is less likely to go bust when it is profitable and has cash coming in the door.
That’s a daunting list of requirements. Only two stocks passed the test this year and two others passed last year.
The paucity of picks caused me some consternation. Indeed, I seriously considered retiring the Stingy Stock method this year and you might be reading my last update on the topic. But I’ll think about the situation, and potential replacements, over the next few months. Nonetheless, I thought that it would be churlish of me not reveal the stocks that currently pass the test.
Before I do, I want to strongly encourage equity investors to hold well-diversified portfolios with a bare minimum of 20 stocks. If you're keen on this year's Stingy Stocks, please use them to supplement an already diversified portfolio.
The two Stingy Stocks for 2018 are Foot Locker (FL) and Signet Jewelers (SIG). Foot Locker is a shoe and apparel retailer. Its shares traded at $44.97 on December 8, 2017 when its earnings multiple was just north of 10 and its dividend yield was 2.8%. Signet Jewelers boasts of being the largest specialty jewelry retailer in the US, UK, and Canada. Its shares traded at $53.22, or 8 times earnings, in early December when it yielded 2.3%.
As always, before buying any stock, be sure to do your own due diligence. Make sure that its situation hasn't changed in some important way. Read the latest press releases and regulatory filings. Scan news stories for developments. Be certain that it fits properly into your portfolio.
We’re now well into a long bull market. So, be careful out there.
Norman Rothery, PhD, CFA,
Founder of StingyInvestor.com, Toronto, Ontario. Email rothery@stingyinvestor.com. Visit www.stingyinvestor.com