
What It Takes To Be Above Average: Uncovering The Traits Of Long-Term Winners
What Makes A High-Quality, Long-Term, Winning Stock?
In the financial markets, what first appears obvious can prove to be misleading upon closer examination. Many investors have a rough idea of the qualities that strong stocks might exhibit, but the factors that make up a high-quality stock might surprise most investors.
There are certain stocks in the market that seemingly just “work” year after year. These are stocks that typically exhibit a long-term uptrend, and their pullbacks are frequently bought up. Some of our favourites in the Canadian markets include Constellation Software (CSU) and Brookfield Corp (BN); these are companies where previous declines have been buying opportunities, and they are not only industry leaders, but broad market leaders. Here we want to explore the common traits and characteristics of Canadian stocks that have either a high 10-year historical return or a relatively low 10-year historical return.
Common Characteristics Of A Long-Term Winner
Our method for identifying the common traits of a long-term winner includes screening all Canadian stocks with a market cap greater than $250 million and looking at the average metrics of those stocks.
In Figure 1, the total number of Canadian stocks that have grown their share price at an annualized rate of 3% to 9% over the past 10 years is 103, they have an average annualized five-year revenue growth rate of 12%, an average forward price/earnings (P/E) of 21X, an average dividend yield of 4%, an average free cash flow yield of 11%, among other metrics. These are low-return stocks for our purposes.
In contrast, there are a total of 88 Canadian stocks that have compounded their share price at a 12% to 24% annualized rate over the past 10 years. These companies have an average five-year revenue compounded annualized growth rate (CAGR) of 14%, an average forward P/E of 23X, an average dividend yield of 2%, and an average free cash flow yield of 7%, among other factors. These are the high return stocks.
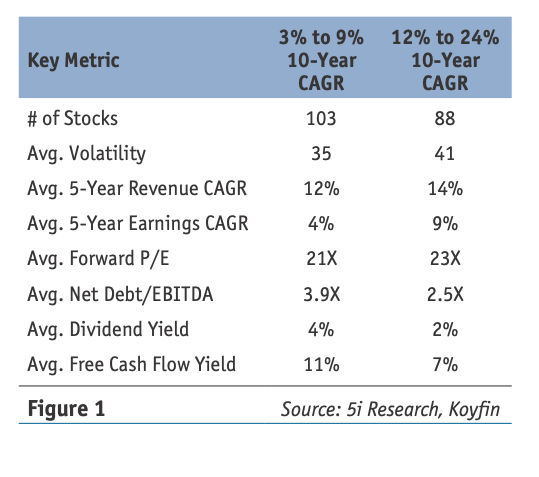
Without doing a deep dive into the numbers, the overarching themes that we observe between historically low-return and high-return stocks include:
- Stocks that have appreciated at a faster rate (referred to here as high CAGR stocks) historically have higher levels of volatility
- High CAGR stocks tend to exhibit both higher sales and earnings growth rates
- High CAGR stocks are generally expensive—they have high valuations
- High CAGR stocks typically have low dividend yields
- High CAGR stocks typically have relatively low free cash flow yields
The stocks that have seen high share price appreciation over the past 10 years are generally expensive, do not have high dividend yields, are volatile, and grow their sales and earnings fast.
For many investors, these qualities may seem counterintuitive to what an investor might be looking for in their portfolio. Naturally, most investors look for stocks that have low volatility, are trading at cheap valuations, and have high dividend yields, but our research shows that these stocks on average can exhibit “value-trap” characteristics.
For investors who are looking for an “above-average” stock that can compound its share price at a high-rate year-over-year, these generally trade at expensive valuations, do not pay a high dividend yield, and are relatively more volatile.
Setting Up A Screener For Canadian Stocks
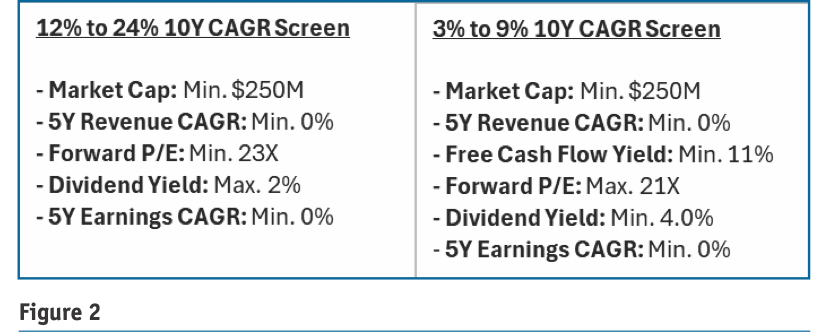
Now that we have the fundamental basis of what the average high-quality, high rate of return, winning stock looks like, we have decided to screen for some of those characteristics (high revenue growth, high valuation, low dividend, etc.) to see what stocks appear. Out of curiosity, we also screened for the criteria that make up the low rate-of-return stocks (high dividend and free cash flow yields, lower valuations, moderate sales growth, etc.). The screen criteria that we used can be seen in Figure 2.
In Figure 3 on the next page, we have outlined the results from those two screeners and compared some key metrics between the two cohorts. We found that the Canadian stocks that exhibited high-quality, winning stock characteristics often had better margin profiles on average, were closer to their 52-week highs (meaning momentum and price movement are better), and were also stocks with high sales growth rates and high valuations.
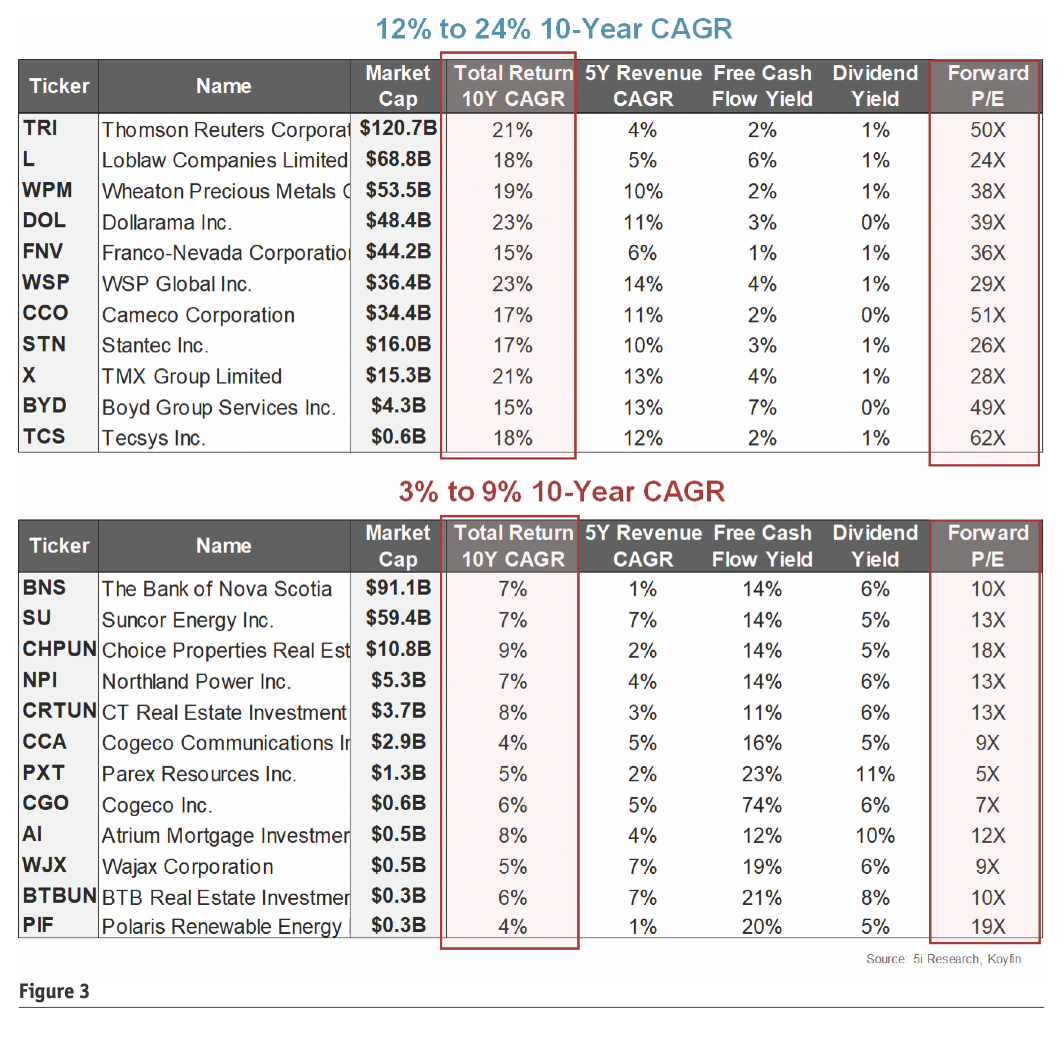
On the other hand, the screener for stocks with characteristics of “losing” names—those which on average have compounded between 3% to 9% over the past 10 years—indicates names with low sales growth, mostly weak profit margins, names that are further from their 52-week highs, and names that appear “cheap” on a valuation basis. These might be decent companies in general, particularly depending on the market environment, but as we can see, their 10-year annualized returns have been weaker than the 12% to 24% list of names.
We want to draw readers’ attention to the red outlined boxes for each list of names. We can see the strong 10-year annualized return rates for the 12% to 24% group, as well as their premium valuations. Conversely, the 3% to 9% group has relatively low 10-year return CAGRs and cheap valuations.
Distinguishing Value Traps From High Performers
Almost all investors want to increase their annual return rates, but of course, this comes at a cost. It is important for investors to understand both the opportunity cost of not earning a higher return on their portfolios, as well as the key characteristics of stocks that typically earn higher returns. The allure of compounding at 12%+ versus 3% may sound nice, but as we demonstrated, this often comes at the expense of fewer dividends, expensive valuations, and higher volatility. If these are qualities that an investor can forego, then seeking out names from the 12% to 24% list can be beneficial. However, if an investor is uncomfortable with earning fewer dividends and paying more for a stock, then seeking the 3% to 9% group of names may be worth it.
We feel it makes a lot of logical sense that the winning names over the past 10 years have high valuations, and high sales growth rates, are trading near their 52-week highs, and have better margin profiles. When screening for a high-quality stock, intuitively it might make sense for investors to want to screen for the best qualities—the highest dividend yield, the highest free cash flow yield, a low and reasonable valuation, low volatility, etc. What we have uncovered is that, in fact, some of the best-performing names over the past 10 years on average have low dividend yields, high volatility, high valuations, and relatively low free cash flow yields. So, when looking for high-quality, winning stocks, we believe that paying a premium valuation, with high sales growth rates and lower dividend yields can be worthwhile in the long run.
Chris White, CFA, Head of Research for 5i Research Inc.