
Buy Canadian, Eh?
Way back in early January 2025, I began posting blogs on why I thought the Canadian markets would outperform the U.S. indices. You can find a blog posted in January 2025 outlining my reasoning for a stronger TSX 300 this year on www.valuetrend.ca, called “6 Reasons the TSX Could Outperform the S&P 500 in 2025”.1
Today, I want to reiterate my call for a stronger relative performance by the TSX. More importantly, I want to discuss the potential for the Canadian dollar vs. the USD in both the short and longer-term picture. After reviewing the outlooks for the TSX 300 vs. S&P 500, and the CAD vs. the USD outlook, I will present you with ValueTrend’s strategy.
S&P 500: The Slower Racehorse
Technical analysis uses two primary trend indicators. One indicator tracks the peaks and troughs on a chart, and the other is tracking key moving averages.
Starting with basic peak/trough trend analysis: A bear market is defined by successive lower highs and lower lows—typically on a weekly chart. Conversely, a bull market is defined by successively higher highs and lows. A market must take out the last high to suggest a reversal from the bear market.
Moving averages are trend-confirming indicators: The two most widely followed moving averages when tracking a market index are the 50-day and 200-day averages. The most important of those averages is the 200-day moving average. That moving average is so widely followed by institutional and retail investors, that a move above or below its line becomes a bit of a self-fulfilling prophecy.
Bull markets are largely supported by a chart with rising peaks and troughs and staying above the 200-day moving average. Conversely, bear markets are confirmed by falling peaks and troughs and staying below the 200-day moving average.
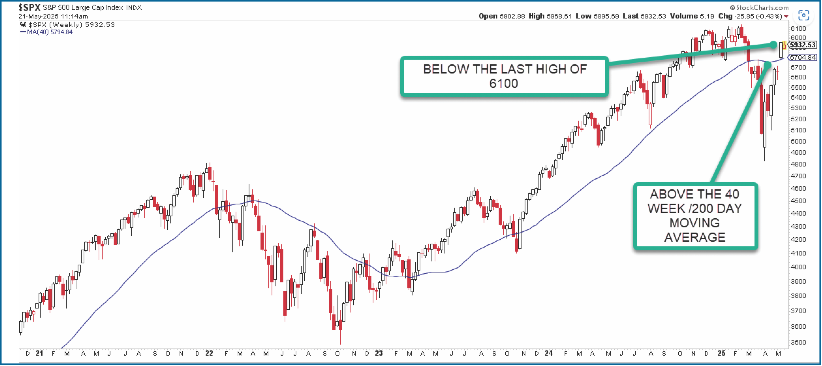
Using the above two rules applied to the S&P 500, we can see that the Index is above the 200-day moving average, which appears as the 40-week moving average on the chart. But it is still below its previous high of 6100 as I write this article on 21 May 2025. The S&P 500 is not back to a bull market until 6100 is taken out with conviction. In other words, it needs to stay above 6100 for a reasonable period before calling off the bear market.
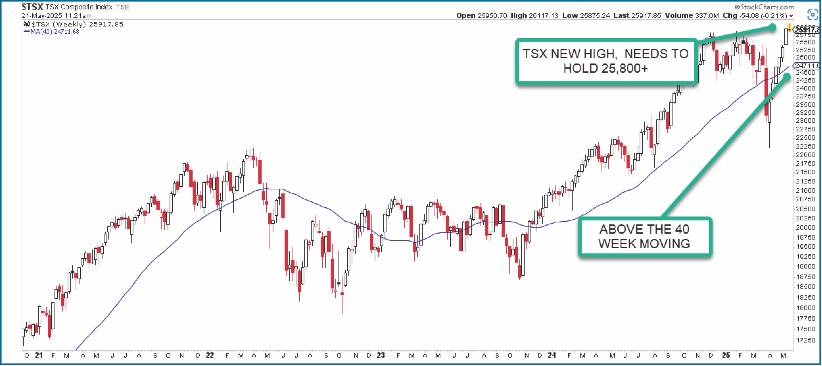
If we apply the same two rules to the TSX 300 chart, we can see that the Index is above its 200-day moving average, and has just recently put in a new high. It’s important to note that the TSX must remain above that old high near 25,800 for at least a couple of weeks before calling it a bull market. By the time you read this article, you will know what the outcome was!
TSX Sector Strength Is Better
The TSX sector concentration differs from its American counterpart. While the S&P 500 Index is concentrated in Technology and Consumer Discretionary stocks (about 33% between them), the TSX is more concentrated in Industrials, Materials and Energy (about 40% between them). Both Indices hold a healthy concentration in Financials, but the 30% concentration in the TSX trumps the 20% Financials held in the U.S. Index. (Pardon the Trump-pun).
The recent outperformance by the TSX has been due largely to Materials (gold, in particular) and Energy (natural gas, in particular). The U.S. was held back by the poor performance of the FAANGS (tech leaders)2 which are concentrated through its large Technology and Consumer Discretionary sectors.
Let’s Talk About the Loonie
It may come as a massive shock for you to learn that the U.S. has been imposing tariffs throughout the world. I know; this is all news to you, right? Okay, tongue out of cheek now. The fact is, President Trump has been forced to the negotiating tables by a weakening bond market in the USA. This, after the tariff announcements created a poor treasury auction in April 2025.
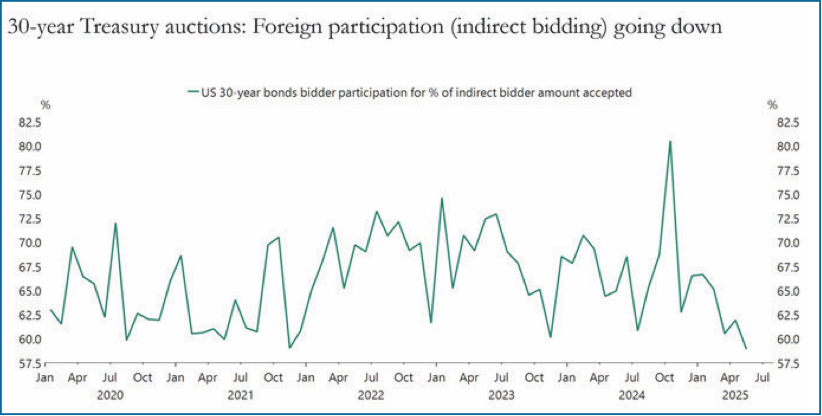
That poorly received auction, in turn, weakened the U.S. dollar against the world basket of currencies massively over March and April 2025. The bond market is sending a message to the Trump Administration. That is, the USA could face a significant recession if tariff rates come in as steep as originally suggested.
Here is the USD chart against the world currency basket.
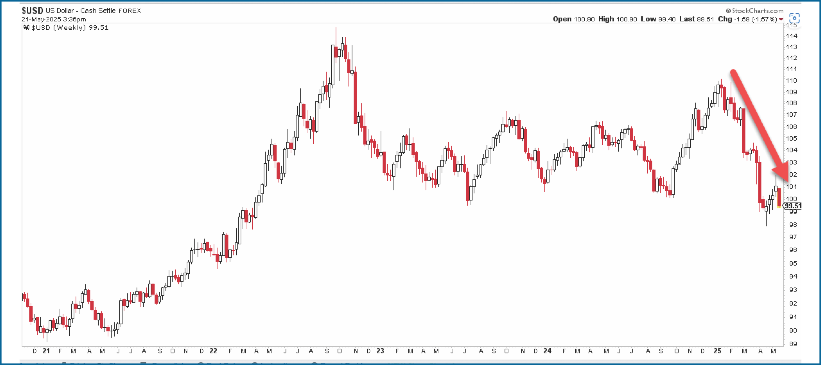
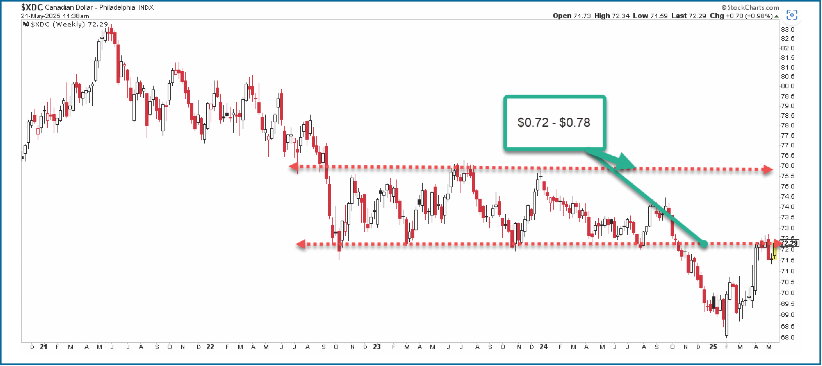
The Canadian dollar (loonie) has underperformed the world basket of currencies. However, the massive decline in the USD has allowed our loonie to outperform the greenback. Our loonie moved from a low of $0.68 to above $0.72 at the time of writing.
Below is a CAD dollar vs USD chart. Note the resistance lines between US$0.72 to US$0.78; My technical view suggests the CAD will have some trouble going through $0.72, but if it does break that point, the maximum upside would be $0.78.
Here’s The Rub
Tariff talks will end in the coming weeks or months. The result of uncertainty lifting after these developments should see a stabilization and strengthening in the USD, and U.S. stock markets. This, in turn, will pressure the Canadian dollar downward, given its already weakening status against leading global currencies like the Euro, Yen, etc.
But Wait, There’s More
A recovering USD is not the only factor to affect Canada’s currency. Fitch Ratings is showing concern over Canada’s balance sheet and credit rating, citing the incoming Liberal government’s 4-year plan to raise Canadian debt by over 20%3. The spending plans, according to Fitch, “will exasperate an already expanding deficit”. Fitch’s warning should be heeded. It adds fuel to the probability of a lower CAD/USD over the mid-long term. The last Liberal government’s spending pushed Canadian debt from $600 BB in 2014 to $1.2 T by 2024. The IMF’s database of the world's 40 largest economies shows that Canada’s debt burden and government spending outpaced every advanced country in the world between 2014 and 2024. With a recession in plain sight, Canada’s growing debt will only exasperate economic and dollar weakness. But don’t worry, I’ve got your back on this!
ValueTrend’s 3-Part Strategy
Above, I presented an argument for technical strength in the TSX 300 Index when compared to its U.S. counterpart, the S&P 500. Those roles can, and likely will, change as tariff negotiations come to a head. As such, ValueTrend has a potential 3-part roadmap to migrate these changes.
1. Near-term: Favor TSX stocks / CAD
We project a near-term outperformance on the TSX and a possible rally by the loonie to $0.74 to $0.76. Currently, ValueTrend is overweighting Canadian stocks and currency.
2. Mid-term (second half 2025, early 2026), increase USD’s & Stocks:
As tariff fears dissipate, we anticipate a rally on U.S. stock markets, and the USD. In turn, we expect a weakening CAD, although we expect the TSX itself will continue to perform well. ValueTrend anticipates buying more USD and U.S. securities in the later part of 2025.
3. Focus:
ValueTrend is focused on favoured sectors on the respective markets as these relative strength rotations between currencies and markets occur. Follow our blogs at www.valuetrend.ca for ongoing timely market commentary.
Keith Richards is Chief Portfolio Manager & President of ValueTrend Wealth Mgmt. He can be contacted at info@valuetrend.ca.
Keith Richards may hold positions in the securities mentioned. The information provided is general in nature and does not represent investment advice. It is subject to change without notice and is based on the perspectives and opinions of the writer only. It may also contain projections or other “forward-looking statements”. There is significant risk that forward-looking statements will not prove to be accurate and actual results, performance, or achievements could differ materially from any future results, performance, or achievements that may be expressed or implied by such forward-looking statements and you will not unduly rely on such forward-looking statements. Every effort has been made to compile this material from reliable sources; however, no warranty can be made as to its accuracy or completeness. Before acting on any of the above, please consult an appropriate professional regarding your particular circumstances.
https://www.valuetrend.ca/6-reasons-the-tsx-could-outperform-the-sp-500-in-2025/
FAANG stocks refer to Meta (Facebook), Amazon; Apple; Netflix, and Alphabet (formerly known as Google)
https://www.fitchratings.com/research/sovereigns/spending-promises-may-compound-canadas-fiscal-challenges-29-04-2025