True Or False? Debunking Investing Myths
Small-Caps Outperform Large-Caps
Investors have been told that small-cap value stocks offer a premium that is higher, on average, than the one from large-cap value stocks. Small-cap value investors must necessarily endure more volatility, potentially higher trading costs due to illiquidity, and a higher risk of permanent capital loss. We accept this as the cost of business with the expectation of superior returns over the long-term. But is this really the case?
A recent study by Jack Vogel, co-CIO and CFO of Alpha Architect, debunks the small-cap value premium myth. In his research paper, “Long Only Value Investing: Does Size Matter”, published in The Journal of Beta Investment Strategies, Vogel concludes that large-cap value and small-cap value stocks earn similar returns in a long-only strategy.
Vogel divides the top 3,000 largest companies from the NYSE, AMEX, and NASDAQ into the 1,000 of the largest and the next 2,000 into the small caps. To avoid the distortion of using a market-cap portfolio, he focused on comparing equal-weight large- and small-cap value portfolios sorted by terciles (thirds), not deciles (tenths) on the value metric of book value/market value. The result was no significant difference between large-cap and small-cap value returns on an absolute and risk-adjusted basis.
Bottom line: In value investing, size does not matter. Valuation matters.
Investor Takeaways:
- Consider dividing value allocations across equal-weight, large-cap value, and small-cap value. Returns will be similar between the two, but there is the benefit of greater diversification as the two groups rarely overlap. Note that large-cap value portfolios are approximately 11 times more liquid.
- Higher returns in small-cap value may be achieved through a long-short strategy (long cheap stocks, short expensive stocks).
Stocks Outperform Bonds Over The Long-Term
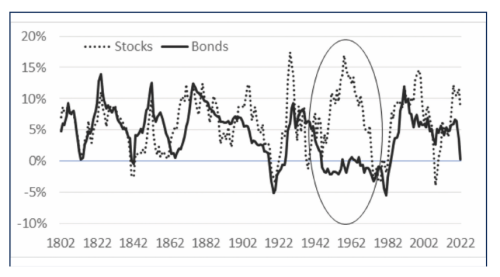
Recent research challenges the accepted wisdom that stocks always outperform bonds over the long term. By correcting for survivorship bias, including more stocks, cap-weighting the returns in U.S. stocks since the 1790s and building a more accurate bond set with investment grade that would have been available to the public during the earlier periods, Edward McQuarrie, a retired professor in California, compared the returns from equities vs. very long-dated (15+ years) and very high-quality, corporate bonds. He concluded that returns from stocks and bonds from 1802-2012 were much closer than originally thought: 5.9% for stocks vs. 4.1% for bonds. While it holds true that stocks outperform bonds, there are long periods, such as from 1793 to 1942, when the returns from both asset classes are nearly the same. (5.5% for stocks; 5.6% for bonds). The period of equity outperformance occurred around the WWII period when stocks trounced bonds from 1943-1982. (7.1% for stocks; -1.3% for bonds)
Bottom Line: Sometimes stocks beat bonds, and sometimes bonds beat stocks, and sometimes they have similar returns. However, based on historical data, there has never been a time when fixed income has outperformed stocks to the same degree that equities tend to outperform bonds. (Between 0%-5% during the past 120 years.)
Trailing Annualized 10Y Stock and Bond Returns, 1802-2022

Source: www.edwardfmcquarrie.com and Verdad analysis
Investor Takeaway:
Despite having higher volatility, stocks are more likely to deliver higher returns over the long term. Capital gains are also tax-advantaged compared to fully taxable coupon payments.
Stocks And Bonds Are Always Negatively Correlated
The period during the last two quarters of 2020 and the first two quarters of 2021 represented the worst valuations for these two asset classes in nearly 45 years, thus setting up 2022 for the year that it was: one most investors would like to forget. The U.S. Aggregate Bond Index dropped 13%, and the S&P 500 lost 18.1%.
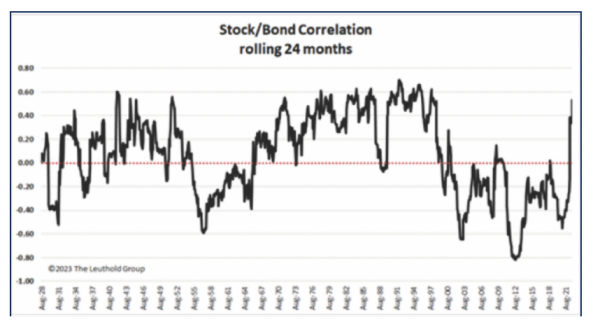
Since the late 1990s, stocks and bonds have been negatively correlated; holding both provided the intended diversification benefits. It also provided some encouragement to investors to buy richly valued equities in the belief that losses in stocks could be offset by gains in bonds. However, data going back to 1927 shows that the relationship between stocks and bonds is cyclical. In other words, a negative correlation is not set in stone. Since the Great Depression of 1929, there have only been two periods of long-term negative correlation: 1956-1965 and 1997-2021.
Bottom Line: Researchers have observed that while stocks and bonds have a similar sensitivity to inflation and interest rates, they respond differently to economic growth and unemployment figures. Positive correlations are more likely when inflation and interest rates are on investors’ minds, whereas negative correlations are more likely to occur when slower economic growth is more of a concern. Regarding inflation, it is not the level of inflation but the volatility of inflation that is statistically significant.
Investor Takeaway:
- After the severe correction of 2022, the expected returns of a 60/40 portfolio look brighter— barring an unforeseen shock—with forward-looking returns approaching recent average returns of around 6.7%, slightly below the 7.9% annualized returns of the past 30 years. (Keeping in mind that there are pockets of extremely high valuations in some high-tech stocks at the moment.)
- According to researchers, neutral and positive correlations between stocks are bonds favour equities and commodities such as oil. Negative correlations tend to benefit Treasuries and commodities such as gold.

Stocks Are Risky
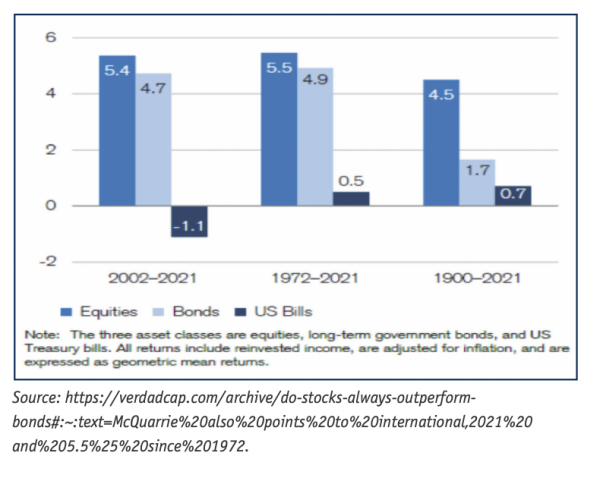
Looking in the rearview mirror, one that projects as far as the year 1900, you simply can’t beat equity returns. The annually updated Credit Suisse Global Investment Returns Yearbook, which tracks bond, bill, and equity performance (after inflation), consistently shows equity outperformance. For the period 1900-2022, U.S. stocks delivered an arithmetic mean return of 8.3% (vs. Canada with 7.0%).
Jeremy Seigel, professor of finance at Wharton School and author of Stocks for the Long Run, has famously observed that, while stocks are more volatile than other asset classes in the short run, they become less risky and a better inflation hedge over the long-term. (The definition of “risk” is downside risk vs. standard deviation.) This time-based effect of lower risk over longer time horizons is often referred to as “time diversification.” Stocks outperform bonds due to two factors: the equity risk premium for owning them and their higher growth rates, which are driven by inflation.
Bottom Line: While stocks may appear riskier due to recency bias, historically, they have been less risky than other asset classes on a real, inflation-adjusted basis.
Investor Takeaway:
An allocation to quality equities is important in a balanced portfolio to generate positive real returns and provide an inflation hedge.

Rita Silvan, CIM is a finance journalist specializing in women and investing. She is the former editor-in-chief of ELLE Canada and Golden Girl Finance. Rita produces content for leading financial institutions and wealth advisors and has appeared on BNN Bloomberg, CBC Newsworld, and other media outlets. She can be reached at rita@ellesworth.ca.

