My Favourite Economic Indicators And Why They Can Make You A Better Investor
When an investor starts the process of choosing a certain stock, if they are a mid-to-long-term investor, they will likely go to fundamental analysts’ recommendations. If they are analytically adapted, they will perform a lot of the many fundamental calculations themselves.
If you are a shorter-time investor or a trader, your focus will likely be on technical analysis. Instead of analyzing financial statements, technical analysis is more concerned with analyzing the stock price chart. From the perspective of an equity investor, the goal of fundamental analysis is to pick stocks with the right valuation and that have the potential for growth. On the other hand, technical stock traders are only concerned with finding a profitable stock trade signal. They accomplish this by using various technical indicators, chart patterns, tape reading or a combination of them.
Both of these methodologies have their pluses and minuses. But one key area that both analytical styles often miss is the economy. The growth or contraction of the economy is so important to stock prices. Analyzing the economy correctly can be as challenging as using either fundamentals or technicals because there are so many different gauges available. However, as in fundamental analysis, there are certain key economic indicators that provide a better snapshot of the economy.
My favourite eight economic indicators are:
- The U.S. yield curve.
- Durable goods orders.
- Building permits and Housing starts.
- Inflation and interest rates.
- Producer price index (PPI).
- Non-farm payroll (NFP).
- Employment figures.
- Consumer spending.
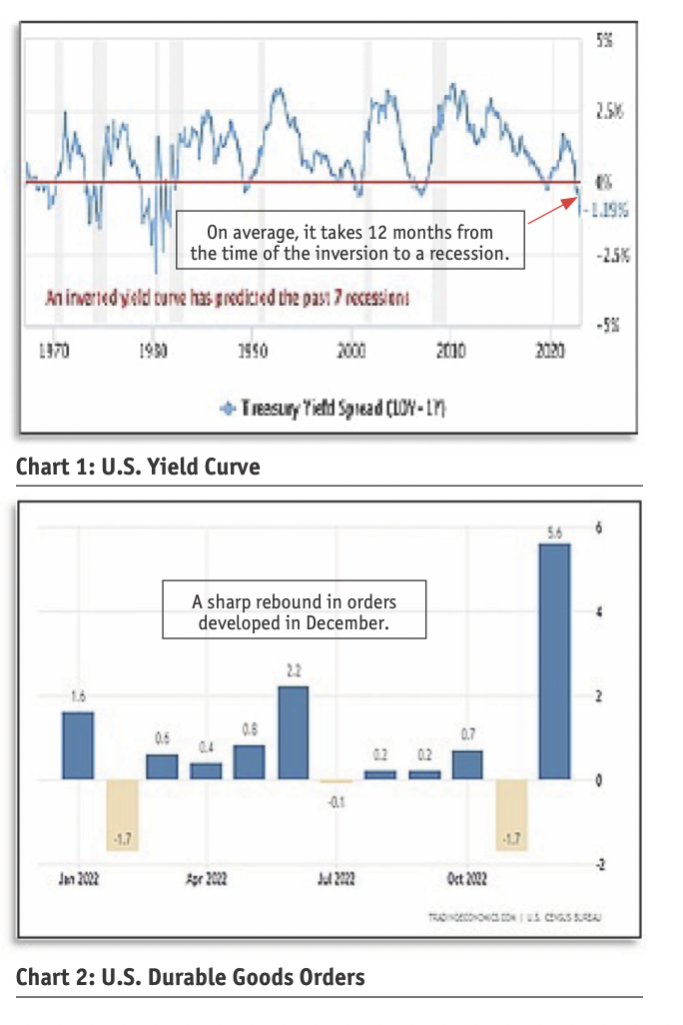
The U.S. yield curve is a leading indicator for recessions. An inverted curve has predicted the last seven recessions (Chart 1).

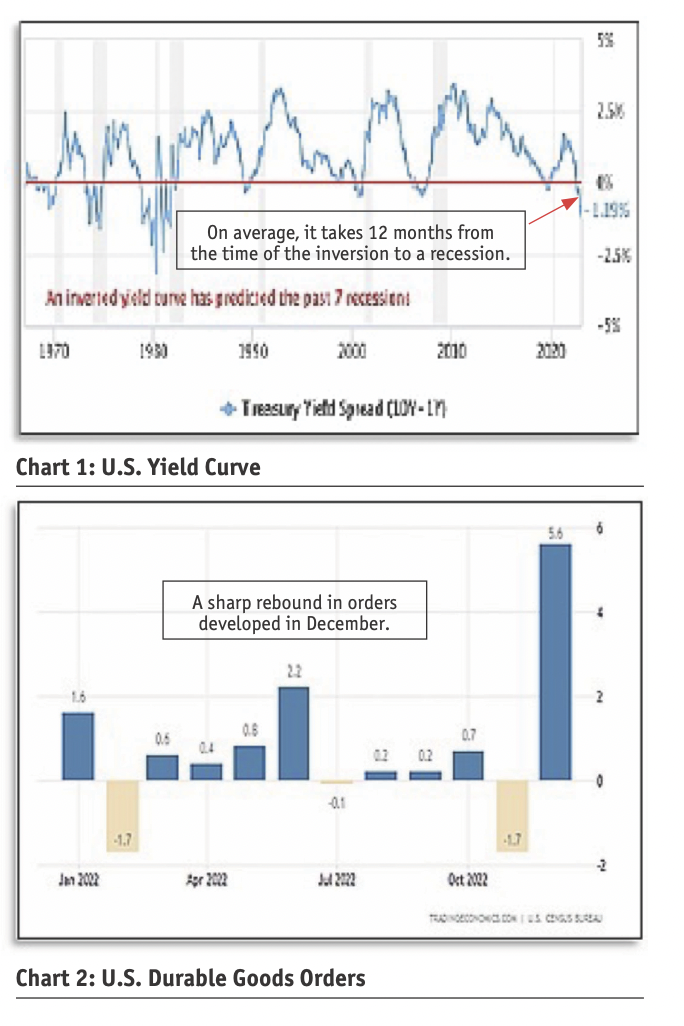
Chart 2 is the U.S. Durable goods orders. It is a measure of the cost of orders received by manufacturers of goods.
Next are US Building permits and Housing starts (Chart 3). Chart 4 is US inflation and interest rates.

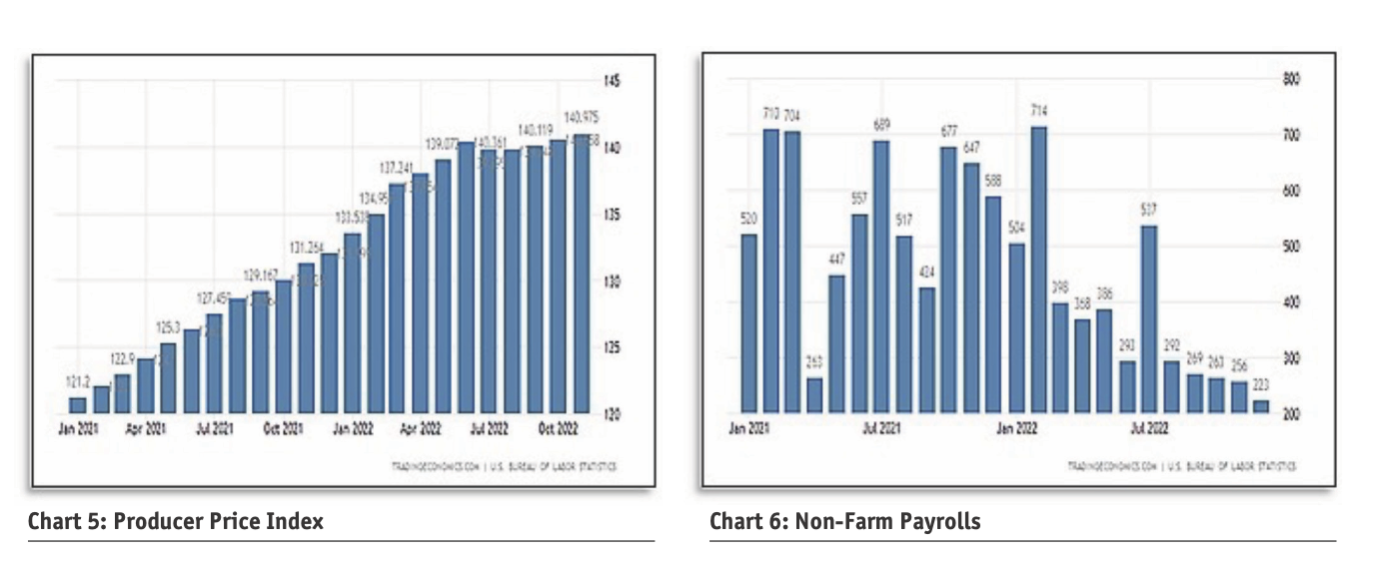
My next important economic indicator is the Producer Price Index (Chart 5). Chart 6, Non-Farm Payrolls, shows a continued slowing of hiring.

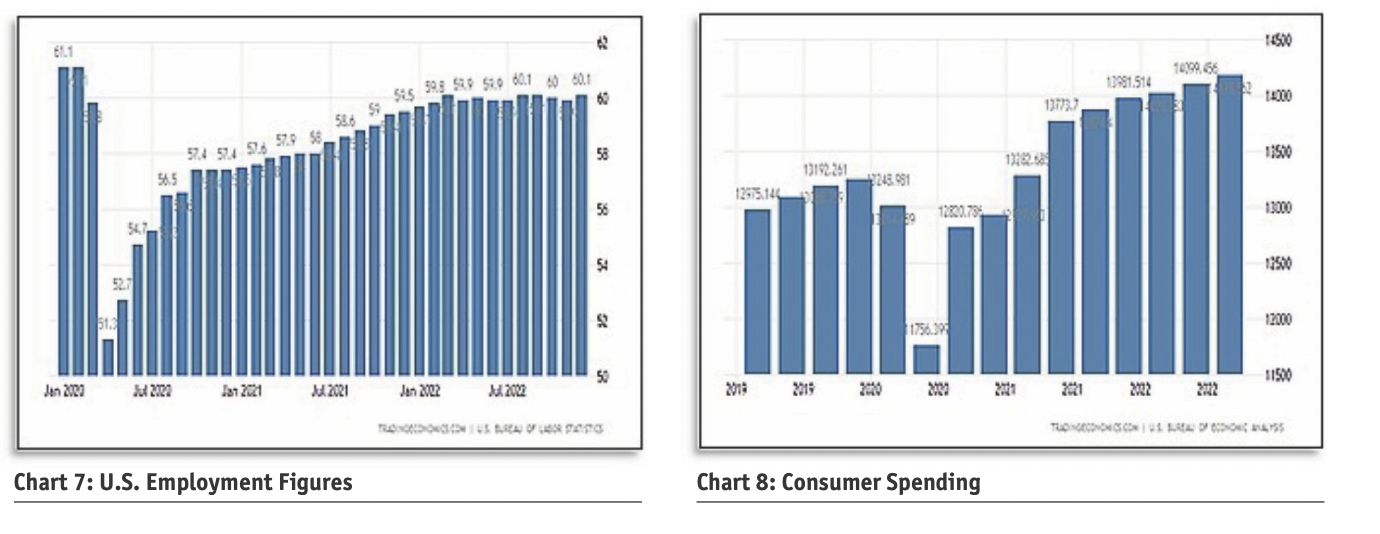
The last two indicators that I find particularly valuable are US Employment Figures (Chart 7) and Consumer Spending (Chart 8).

Bottom Line:
The first three charts paint the U.S. economy as continuing to advance. An inverted yield curve points to a recession and market correction, but not for, on average, 12 months after the inversion. That points to mid-2023. Durable goods orders are currently in a positive position and at one of the strongest rebounds over the last five years. These two charts are positive and negative. U.S. Building Permits and Housing starts appear to have peaked in early 2022 and are now rolling over. This is also negative. U.S. inflation seems to have crested, thankfully, but the Fed is keeping upward pressure on rate increases. The Producer Price Index is still trending up. These three are mostly positive. The Non-Farm payroll is negative. 18 months of declines. The last two charts are positive for the U.S. economy. Employment remains up, and consumer spending has just reached a two-year high.
Overall, the U.S. economy is still positive but does not appear as overextended as in 2000 or 2007. As consumer spending equals about 60% of the Gross Domestic Product (GDP), there doesn’t seem to be a major weak spot there. The concern lies with the U.S. inverted yield curve. Canada also has an inverted curve.
Donald W. Dony, FCSI, MFTA, is an analyst and editor at www.technicalspeculator.com. He can be reached at e-mail: dwdony@shaw.ca or Twitter: @DonyFcsi.

