
What History Can Teach Us About Upcoming Market Trends – Part 1
I was asked a question by a reader of my blog a couple of weeks ago. It was regarding the potential for a sideways market emerging after the current bear trend ends, rather than the emergence of a new bull market. As it happens, more than 20 years ago, in the January 2001 issue of Canadian MoneySaver, Bull, Bear or Neither? (canadianmoneysaver.ca), I wrote an article that was one of his most important market observations at the time. The article, entitled “Bull, Bear or Neither”, appeared to be among the first to suggest the end of the mega bull market that, at the time, had been the 1982 to 2000 bull. I postulated the potential of a choppy sideways trading range for the coming decade. My observation at the time was that the US markets had experienced several prolonged sideways periods over its 100+ year history. These choppy sideways periods occurred after each significant bull market.
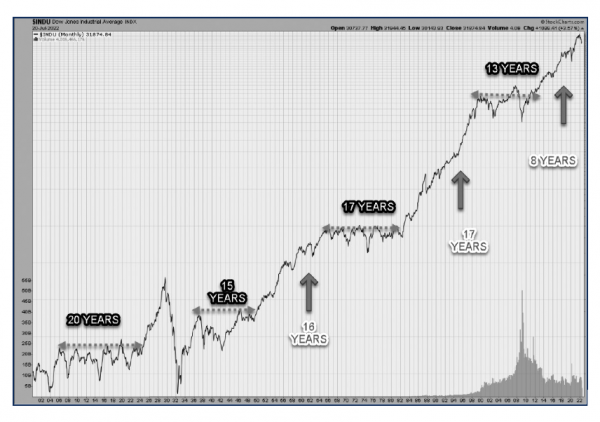
Going back to the early 1900s, there have been four major periods of sideways patterns on the DJIA similar to the current trend, as seen on our long-termed chart at the top of this paper.
The DJIA was unable to penetrate approximately 100 for the 20-year period between 1905 and 1925.
It was also unable to penetrate approximately 200 for the 15-year period between 1935 and 1950.
The 1965-1982 period (17 years) saw a wall on the Dow near 1,000.
Finally, 1999 – 2012 saw its 11,000-wall breached in 2008 on the DJIA…. but the S&P 500 shows a flat lid during the same period near 1500. Either way, that was a 13-year sideways market.
In my original article, I suggested that the year 2000 would begin a period where markets would again trade sideways. I suggested that we would enter a period with dramatic volatility. This volatility would be caused by the rotation of capital between various sectors and between stocks and cash. I also suggested that this sideways trading range would likely continue for many years to come before a new bull market would emerge.
It turned out that I was right. In fact, that sideways market lasted for 13 years. See the chart below for the SPX, where no new highs appeared between 2000 and 2012. The S&P 500 could not cross 1600 for that 12-year period.
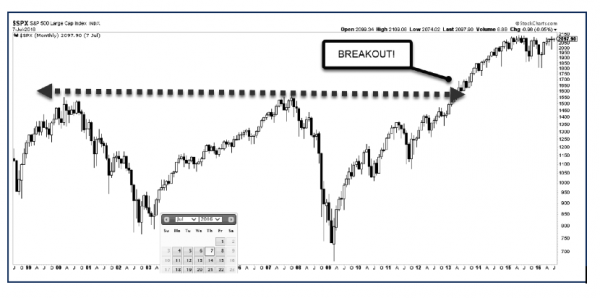
In the MoneySaver article, I also postulated in that original article that the market would eventually break out into another long bull market. The chart above illustrates this pattern. Thereafter, history would continue to repeat itself through the long bull and long sideways cycles over the coming decades. Per my article in the early 2001 MoneySaver issue, the market did finally break its highs in August of 2013.
A new bull market cycle emerged in August 2013. That bull market cycle may have ended this January. Call it a “circle of life” for the stock market. Wash, rinse, repeat.
In this article, I’d like to bring you up to date on our current thinking regarding the macro-outlook for the markets. I’ll make an argument for the potential (not a prediction) of a new choppy sideways period for the markets and provide insight as to the possible causes of such seemingly erratic market behaviour.
Technical Overview
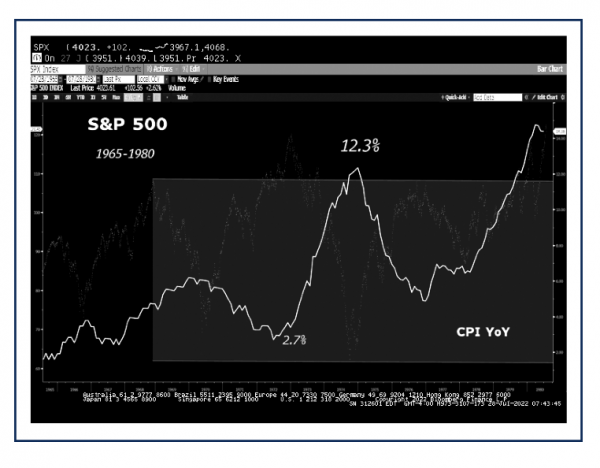
As I noted in my original prognosis 20 years ago, extended sideways periods have a long-lasting ceiling and floor to them. Back in 2001, I felt that the market bore some resemblance to the sideways market period between 1965- 1982. Then, the DJIA could not penetrate 1,000 for 17 years. Aside from dividends, buy-and-hold index investors realized few net gains in their portfolios during that period. Sell-offs lasting up to two years in length tested the convictions of even the stodgiest long-term investor during that 17-year time frame. One of the strong commonalities of today’s era with that of the 1965- 1982 period was that of inflation. CPI (inflation) was rising for most of the 17-year period. Did that contribute to a sideways macro market pattern? Perhaps it did.
 There’s another similarity in the current era to the 1965-1982 era. Interestingly, in October 1974, about the halfway point of that 1965-1982 period, a particularly dramatic selloff occurred. The Dow was cut in half in 1974! Perhaps that major selloff could be likened to last 2020’s COVID-induced selloff. In fact, like the 2020 crash, the selloff in January 1975 took the markets to lower lows from their prior sideways pattern. The recovery from the 1974-1975 lows, back to the top of the trading range, took 12 months to materialize. The DJIA was back to the 1,000 level by December 1975.
The 2020 COVID crash recovered in far less time than the 1974 crash, and that recovery pushed markets to much higher levels – whereas the 1975 levels were contained to their former resistance point near 1000 on the DJIA. However, if one were to peel the drivers of the COVID rally out of the S&P 500 index (growth, technology, stay-inside stocks) – you might have noticed that staples, commodities, utilities, retail (x-Amazon), communications and other sectors were treading water in the 2020 market rally. These sectors made little or no money!
The S&P 500 had a vastly overweight capitalization weighting in the technology and growth names during the COVID rally following the 2020 crash. It had less concentration in other sectors, including the sectors noted above. So – it could be that the market was already in a sideways period prior to 2020. It was just less visible, given the high weighting of the growth names.
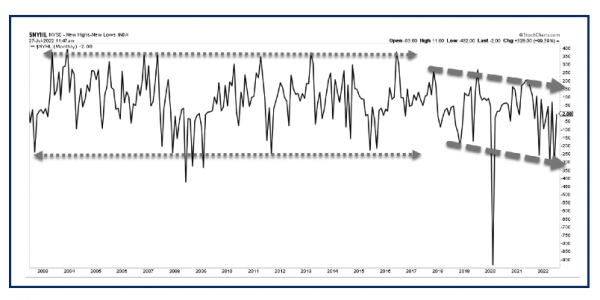
The chart below is that of the New High/Low breadth indicator. It measures New Highs minus New Lows on the NYSE. Note that since 2017 (Trump & Biden era of easy money), the market has had fewer New Highs vs lows by trend. In other words, the trend has been for fewer overall new highs on the broad market despite a rising index. In other words, fewer stocks doing more lifting in the last five years. Tech, growth, and FAANG (Facebook/Meta, Apple, Amazon, Netflix, Google) were the dominant drivers of the index.
Negative Wealth Effect Psychology
Aside from technical trends, human emotions tend to reinforce a market trend. The soaring market of the late 1990s fed upon itself and caused investors (and businesses) to become overly bullish. As they herded together, the market and economy soared to the point where even leading economists were talking about a new paradigm in growth and technology stocks. Nearly three years later, opposite bearish psychology caused investors, consumers, and businesses to become very cautious, further fuelling the bear market as well as reining in an economic recovery.
A similar pattern emerged between 2016 and 2021 after President Trump was elected (bullish business policies and easy monetary policy), followed by similar easy monetary policies by President Biden in 2020. Like in the late 1990s, investors once again bid growth stocks to stratospheric highs. Now, we are experiencing the same bear market pattern as seen after the 2000 tech bubble. Growth stocks sold off earlier this year, followed by a broader market decline. Investor and consumer sentiment is declining. A mild recession or “stagflation (slowing growth and persistent inflation) is likely. History repeats.
Interestingly, prior bull & bust market patterns do not seem to deter future herding behaviour related to investment activity, as you would think it should (i.e., we don’t always learn from our mistakes). Indeed, the financial markets can be both the cause and effect of investor decisions. A rising market fuels more buoyant spending and investment, which in turn fuels further economic growth, which in turn drives the market higher. The opposite happens in a bear market. The importance of this negative/ positive feedback loop cannot be understated. See my book, Smart Money/Dumb Money: Beating the Crowd Through Contrarian Investing for more on that pattern.
I’ll be back with Part 2 of this macro market outlook. In that column, I will cover potential investment opportunities that can come out of such market cycles, should this time be similar to the historic patterns I’ve discussed today.
Keith Richards is Chief Portfolio Manager & President of ValueTrend Wealth Mgmt. info@valuetrend.ca.
He may hold positions in the securities mentioned. The information provided is general in nature and does not represent investment advice. It is subject to change without notice and is based on the perspectives and opinions of the writer only. It may also contain projections or other “forward-looking statements”. There is a significant risk that forward-looking statements will not prove to be accurate and actual results, performance, or achievements could differ materially from any future results, performance, or achievements that may be expressed or implied by such forward-looking statements, and you will not unduly rely on such forward-looking statements. Every effort has been made to compile this material from reliable sources; however, no warranty can be made as to its accuracy or completeness. Before acting on any of the above, please consult an appropriate professional regarding your particular circumstances.
Keith Richards is Chief Portfolio Manager & President of ValueTrend Wealth Mgmt. He can be contacted at info@valuetrend.ca.
Keith Richards may hold positions in the securities mentioned. The information provided is general in nature and does not represent investment advice. It is subject to change without notice and is based on the perspectives and opinions of the writer only. It may also contain projections or other “forward-looking statements”. There is significant risk that forward-looking statements will not prove to be accurate and actual results, performance, or achievements could differ materially from any future results, performance, or achievements that may be expressed or implied by such forward-looking statements, and you will not unduly rely on such forward-looking statements. Every effort has been made to compile this material from reliable sources; however, no warranty can be made as to its accuracy or completeness. Before acting on any of the above, please consult an appropriate professional regarding your particular circumstances.