
Insights From ETFs: U.S. Sector ETFs: What the last three months and last year could mean
In this piece, we will look at the performance of U.S. sectors over the last three months compared to the last year and interpret what it tells us about the markets today and what trends could arise going forward.
The Exchange-Traded Funds (ETFs) we use for this analysis are the Select Sector SPDR Trust ETFs, which are among the largest and most generic sector ETFs listed in the U.S. For ease of reading the charts below, here is a table that provides the ETF names, their corresponding tickers and three-month and one-year returns.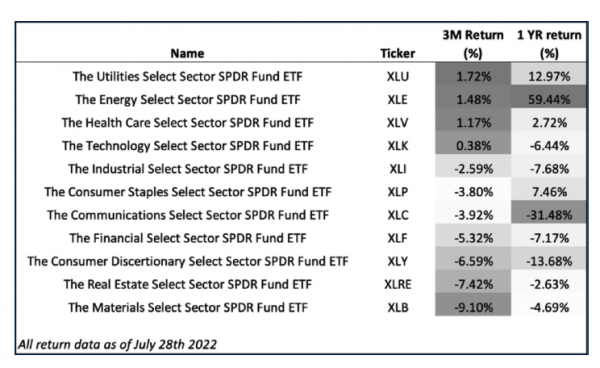
Trends:
1) Sector performance converging
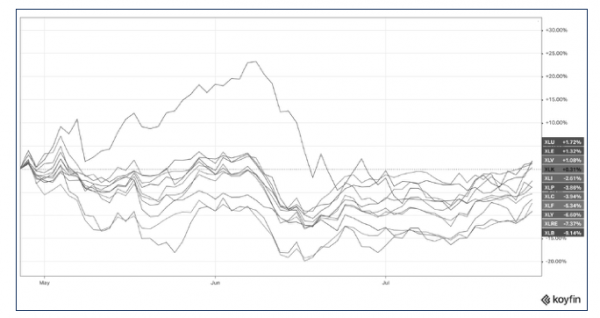
Looking at the three-month chart, we can see that the Energy and Materials sectors are beginning to come down significantly over the last two months while other sectors have been doing well over the last month or so. Since mid-June 2022, we see most sectors beginning to form more of an upward trend while Energy and Materials have begun forming a downward trend.
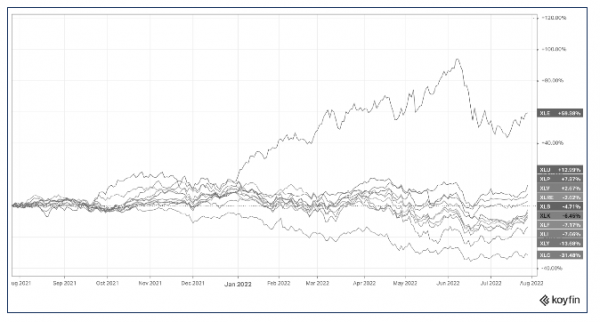
When looking at the performance numbers for the last three months, each sectorís performance is within the single digits, whether it is positive or negative performance. This is an indicator that markets are potentially beginning to normalize and perhaps form a bottom. Over the last year, the difference in sector performance shows a much larger divergence between the top and bottom performing sectors (Energy over 59% vs Communications at -32%). This type of divergence is not often seen over a 12-month period, and so we do expect some sort of normalization or correction in both extremes over the next year or so or once market sentiment improves.
2) Energy and Materials stocks are cooling down
This has many implications, not the least of which is inflation, which has arguably been the main cause of the market sell-off. Over the last quarter 2022, the Energy sector has returned a modest ~1% return while Materials are down nearly 10%. While investors are heavily focused on what the Federal Reserve and other central banks will do to fight inflation (i.e. reduce demand to lower prices by raising interest rates), it is also possible that much of the cooling down of inflation will come from natural shifts in supply and demand. High prices ìshouldî naturally deter people from buying as much as they used to, and improvements in supply chains should help address supply shortages. It is difficult to measure, but it is not likely that the cooling down of materials and energy sectors (and, in turn, their respective commodity prices) is purely a result of higher interest rates. Energy and materials are particularly important as they are the sectors responsible for essential economic inputs (oil, gas, resin, lumber, metals etc.).
Three Month Return Chart
One Month Return Chart
3) Defensive sectors are still a good bet
Investors who are looking to play defensive, non-cyclical sectors such as Utilities, Health Care, and Consumer Staples have proven to do their job well in helping to cushion volatility and even provide some upside for investors.
As the two charts demonstrate, while it is a bit of a mixed bag over a three-month period (the Consumer Staples ETF being the only defensive sector ETF that is down), all defensive sectors are up on a year-over-year basis, vastly outperforming their cyclical counterparts. Defensive sectors also tend to consist of more dividend-paying companies, which have been favoured by investors amid the market sell-off as they help offset some of the capital losses, especially as bond prices continue to fall as interest rates rise. However, it is important to remember that defensive sectors are not immune to market sell-offs, and as far as inflation, war, and economic slowdown go, we are not out of the woods yet.
4) The worst performing sectors are cyclical
The obvious exception here is Energy. However, looking at sector ETFs for the Financial sector, Technology, Consumer Discretionary and Industrials, they are all down on a year-over-year basis and still in the red on a three-month basis (though they have begun to make a turn to the upside). Due to the potential cooling of inflation discussed earlier, we think the sectors which performed the worst are most likely to see a îbounceî with an improvement in market sentiment.
Looking at the one-year chart, we see a large divergence between the obvious winning sector (Energy) and other cyclical sectors. We think it is likely that out of conservatism or fear of uncertainty regarding inflation and other economic factors, these sectors have been oversold. We believe that investors who are looking to turn things around in their portfolios are more likely to do so within cyclical sectors over the next year or two.
A foggy crystal ball with a silver lining
No one has a crystal ball to predict what will happen next in the markets, and the timeline when inflation issues will be resolved is still not clear. However, the silver lining here is that the markets have been getting some grasp on this. Another silver lining is that a lot of damage has already been done, and we are beginning to see some consolidation in each sector.
Consolidation is good as it gives investors more time to ìplace their betsî and build long-term positions. Supply and demand issues need time to be sorted out, and it has certainly felt like a long year for many investors so far. Finally, rising interest rates should help cool down inflation in an already cooling global economy, which should help make the outlook clearer going forward.
Disclosure: Authors, directors, partners and/or officers of 5i Research have a financial or other interest in XIT and ZRE.
Moez Mahrez, CFA, Analyst for 5i Research Inc.