Are We In An Investment Bubble?

 I’d like to discuss the investment cycle, and where we may be within that cycle. My perspective as a Technical Analyst involves applying sentiment studies and investor psychology to market movements (this also called behavioral finance). In my way of thinking, a properly structured Investment Cycle should incorporate investor emotion in conjunction with technical trend analysis and economic factors.
This brings me to an update on my new book.
Some of you might be aware that I’ve been writing a new book on contrarian investing. I’m down to the home stretch –I recently sent the manuscript to the editor. I expect that, as always, he will find a myriad of errors and point out what an amateur writer I truly am (it’s always a lesson in humility). If you have ever written a book or know anyone who has done so – you will relate. Writing a book is a FAR bigger task than most imagine. Especially when writing a technical book. Writing a column is comparatively easy. I just spit out whatever has been on my mind or whatever general trading direction I am focusing on at the time - and presto! Instant article.
On the other hand, a technical book has to flow and connect a myriad of concepts and analytical tools to educate the reader in an easy-to-follow format. My books always conclude with a final chapter called “Putting it all together” (See my books SmartBounce and Sideways). In that final chapter, I take everything I’ve covered – which in the current book’s case is vastly more information than I covered in the first two books – and help the reader incorporate it all into a manageable trading plan. My goal for any of my books has always been to help retail investors understand analytical processes in an easy-to-understand format. The good news is that I’m in the home stretch. For anyone who read Sideways and felt it needed to go deeper down the rabbit hole of understanding advanced analysis - this book is for you! I expect to have the book in distribution by July of this year.
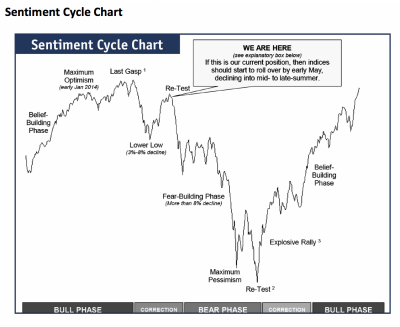
In the opening chapter of the book, I discuss the Investment Cycle. I present two variations of understanding the cycle. One is from the investor emotion perspective – which you may have seen before. It’s the classic fear and greed cycle. Here is an excerpt from that introduction (unedited!) with a chart of that behavioral cycle:
The Investment Cycle - From the manuscript of my new book:
The diagram on the next page is one that you may have seen before. It represents the investment cycle, as driven by investor crowd behavior. The cycle moves between bull markets and bear markets as investors rotate between the various stages of euphoria and despair. (Note: On this diagram is noted a potential position as to where we may be in that cycle right now, in particular for the NASDAQ – along with some potential timing of the next phase in the cycle.)

Sentiment Cycle Chart
While examining the investor behavior cycle chart, you may wonder how an investor can quantifiably identify euphoric market conditions that lead into market peaks. Conversely, you may wonder how we might identify declining markets near the capitation stage of a market bottom. Is there a way to identify which part of the behavioral cycle the market is currently in, and profit by these peaks of emotional buying and selling behavior? Jason Geopfert of Sentimentrader.com suggests that market tops and market bottoms are often identified by a number of reoccurring traits. I’d recommend you keep the following lists handy as a “check list” to regularly ascertain market conditions. The more of the following conditions present, the more likely we are at or near a market top:
- High optimism.
- Easy credit.
- A rush of initial & secondary offerings.
- Risky stocks outperforming quality stocks.
- Stretched valuations.
Goepfert also suggests that market bottoms also coincide with reoccurring traits. As with market topping conditions, the more conditions for the list below that present themselves, the more likely we are at or near a market bottom:
- Extreme pessimism.
- Oversold breadth (few stocks moving up vs. moving down).
- Risky stocks crash.
- Negative media coverage.
- Credit slams shut.
- Comments based on that book excerpt.
The reason I wanted to copy the above excerpt from my soon-to-be published book was to stimulate some thinking as to where we may be in the investment cycle. Optimism for stock markets has been very high over the past few years. This excitement built its way into a potential crescendo that might represent those final phases of a topping market.
If we look at Goepfert’s first list (on identifying a topping market) above, we might draw some parallels of those conditions to current markets. Let’s go through the list:
- Are you seeing high optimism in the markets now?
- Can it be argued that our current access to credit is easy- perhaps too easy?
- Have you noticed that secondary market offerings are rising?
- Would you agree that the outperformance by higher risk stock sectors like solar and stay-inside technologies and crypto currencies is a sign of market speculation?
- Would you agree that the SPX PE ratio of 40 (trailing), which is the third highest in history, is scary?
So…it does appear that we have all the makings of a market bubble at hand. However… The problem with viewing the above list is that these factors are fairly “big picture” by nature. We need to quantify the timing of such a top (if we are near one) by using more quantitative measurements. That’s where sentiment indicators – which I discuss in my new book – come in. I use a few of the more reliable sentiment studies in my Bear-o-meter. If you visit my blog at www.valuetrend.ca, you can see a monthly reading of that risk/reward indicator. I post the reading at the beginning of each month.
I’d argue that the Canadian real estate market is also approaching bubble levels. Economist David Rosenberg notes that home-price to rent and home-price to income the numbers in Canada are higher than they were during the U.S. real estate bubble in the early 2000s. The rampage is so strong that not only are there multiple offers for houses willing to pay exorbitant asking price premiums, but some are buying sight unseen (virtually). And one in ten buyers are learning the bank appraisal is below what they are paying for their house! Sounds like 2006/7 when you bought high “knowing” it would go higher. Until it didn’t.

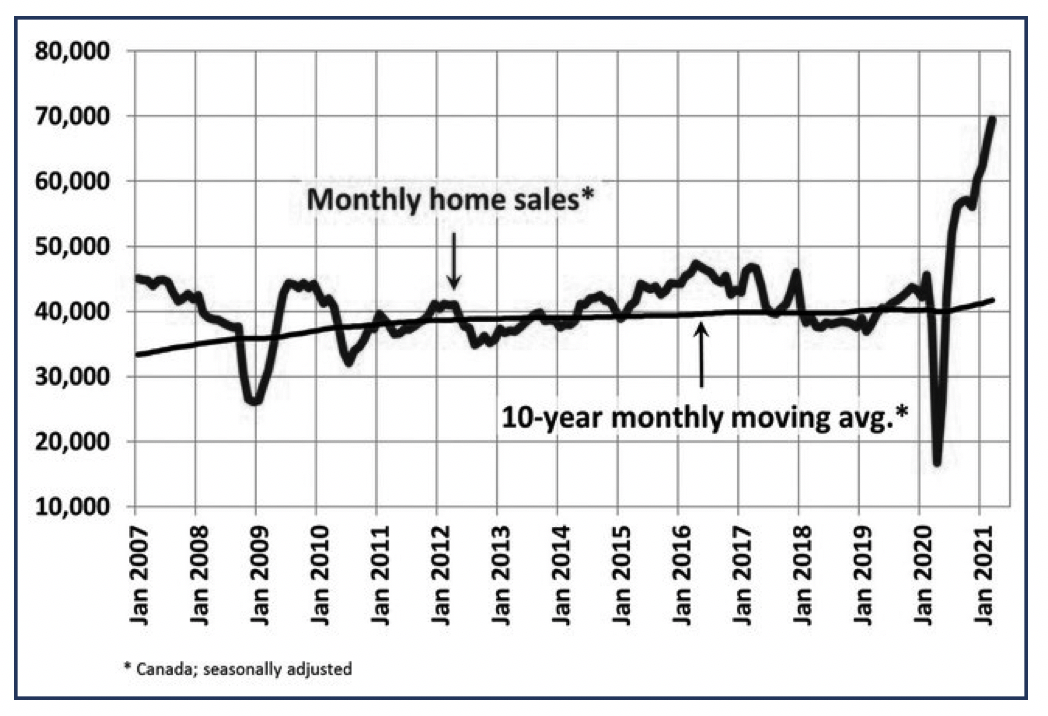
Above is a chart (I believe the source is Stats Canada) updated to the end of March for Canadian housing sales that goes back to the 2007 housing bubble. Note the 10-year Simple Moving Average is around 40,000 monthly sales. Since the COVID crash, sales have literally gone parabolic. At 70,000, they are above that Moving Average by 75%!!! There’s no arguing that housing sales are aggressively up from an historic perspective. Clearly, this is a red flag for anyone believing in mean-regression – of which I am one.
Similar to housing sales, we are also witnessing overbought stock markets. The S&P 500 has been trading between 10% - 15% above its 40 week Moving Average since December of 2020. Historically, the index trades 3% - 10% above that Moving Average when in an uptrend. Spikes above this level approaching 15% typically lead into a market correction.
This column, despite the undertone of warnings, wasn’t written to have you sell your stock portfolio or real estate investments and run for the hills. Markets can remain wrong longer than you can remain solvent, as Keynes once said. Just because the conditions are there for a bubble, doesn’t mean you will time it correctly and get out at the top. After all, the market can remain “wrong” longer than we might anticipate. For this reason, I continue to endorse the basic technical analysis approach to managing one’s investment risk. This approach does not get you out at the top. It will, however, get you out with less damage than a buy and hold strategy during a bear market selloff. Effectively, you want to watch a weekly chart for signs of a breakdown in trend. Bullish trends are identified by a series of higher highs and higher lows on a weekly chart, with the market remaining above its 200 day Moving Average. When the market violates this rule, I begin to step out – but I do it in stages. You can read my book Sideways: Using the Power of Technical analysis to Profit in Uncertain Times for a detailed breakdown of this trading strategy.
Rather than assume that now is the time to sell when the market displays some signs of bubble-conditions, it’s better to follow a strategic way of looking at things. If you will follow a basic trend analysis approach as described in my books, along with following my monthly Bear-o-meter risk/reward readings on my blogs, you will have an edge. We’ve been seeing a pattern of increasing risk/reward on the Bear-o-meter of late. Yet, basic trend analysis remains bullish. As such, we have moved into lower-risk sectors like consumers staples, utilities, and dividend payers after taking profits on some of our faster moving stocks. We’ve also raised a bit of cash, around 15% in our Equity Models at the time of writing. But we’ll not raise too much cash until we witness a deterioration trend.
We want to remain invested when the trend is favorable and avoid holding too much cash so long as our quantitative risk /reward measurements have not deteriorated aggressively. As either of those factors deteriorate, we will further reduce our risk exposure. For me, that’s more important than chasing every last nickel in an overinflated market.
Keith Richards is Chief Portfolio Manager & President of ValueTrend Wealth Mgmt. He can be contacted at info@valuetrend.ca.
Keith Richards may hold positions in the securities mentioned. The information provided is general in nature and does not represent investment advice. It is subject to change without notice and is based on the perspectives and opinions of the writer only. It may also contain projections or other “forward-looking statements”. There is significant risk that forward looking statements will not prove to be accurate and actual results, performance, or achievements could differ materially from any future results, performance, or achievements that may be expressed or implied by such forward-looking statements and you will not unduly rely on such forward-looking statements. Every effort has been made to compile this material from reliable sources; however, no warranty can be made as to its accuracy or completeness. Before acting on any of the above, please consult an appropriate professional regarding your particular circumstances.

