
BTSX – Then, Now, And In The Future – Part 1

I am Dave Stanley back from retirement to share with you some great results from our BTSX experiment and mention some changes the column is undergoing. We now have 30 years’ worth of data and I hope it will excite you as much as it has us. First, though, I think it might be worthwhile to go back over the history of how this all developed.
I wrote the first BTSX column in 1996, a year after I took advantage of an early retirement package. A friend had given me a subscription to the CMS as a gift which led me to contact the Editor, Dale Ennis, with some criticisms on an article dealing with dividends. He asked me if I thought I could write on this subject and I accepted Dale’s offer, leading to 20 years of columns and a great deal of learning on my part.
In the beginning I knew virtually nothing about investing other than buying savings bonds and mindlessly handing my money to mutual funds salespeople. What I hoped to do was to be able to construct some method that would allow me to control my own investing. Given my lack of knowledge in the area it would have to be simple to understand, easy to implement, inexpensive, and offer the hope of sustainable above-average results. So, when I read ”Beating The Dow” by Michael O’Higgins it struck a receptive chord.
Mr. O’Higgins wrote that simply by selecting on a yearly basis the top ten yielding stocks in the blue-chip Dow 30 Industrial Index an investor consistently could achieve higher results. Amazing! He produced convincing data as well as having skin in the game, making his work very believable (as an aside I agree with Nick Taleb that with most things, but especially finances and investing, if someone tries to persuade you of a particular course of action and cannot cite honest data as well as having some skin in the game then you are listening to or reading just another opinion with no reason to think it is superior to your own.)
I could think of no reason why O’Higgins’ approach should not work with our Canadian stocks and so the BTSX system was born by pure plagiarism. As I look back now it was mistake to assume this perfect compatibility; U.S. and Canadian blue-chip indices are very different and I should have allowed for that.
In any case, no matter how flawed, BTSX worked for more than 20 years and worked well. Let’s look at our results.
Figure 1 shows total return data for the full 30 years in two segments: the oldest data is mine and the newer part is Ross Grant’s. Note how the two segments overlap quite well. What strikes me about this graph is the large change in amplitude from year to year. As investors we must get used to such gyrations since, although in general the overall trend of the market is upwards, taken on a yearly basis we see great and unpredictable variations.
So, did we beat the TSX? Yes, and quite convincingly. Over our first 30 years the average yearly return for BTSX was 12.4% compared to 9.6% for the index, an almost 30% difference. If an investor could beat the index by this wide a margin over a 30-year time period I predict a quite pleasant retirement would lie ahead.
Over the years we have had to use several indexes for comparison to our results and it was only when the iShares S&P/TSX 60 ETF (XIU) appeared that we could access reliable data that was not considered by the provider to be proprietary. But all the data we used were total returns of a Canadian blue-chip index. It is important when viewing investing results, especially marketing-based information, to verify that proper comparisons are made.
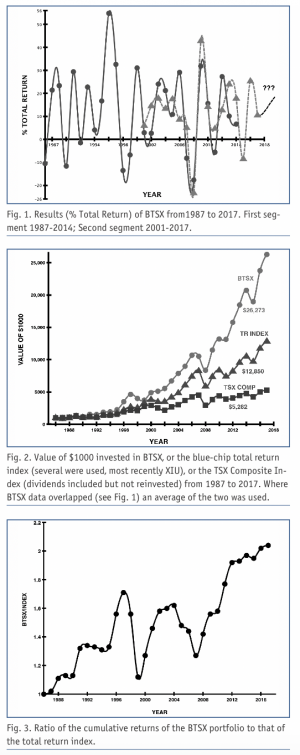
While our results are gratifying, the whole emphasis of BTSX throughout its existence has been long-term success. In Figure 2 we present data showing how a $1000 investment grew over 30 years. Immediately it is apparent that BTSX produced over twice the wealth as the index. It is also obvious that the larger TSX Composite Index, with dividends included but not reinvested placed a distant third. I am going to predict that there is not a mutual fund or ETF that invests in Canadian large-cap, blue-chip stocks that can match our record over this time period. The most important aspect of Figure 2 is that we can see clearly the advantages of compounding dividends. Never have I found a better example of compounding that used real data.
Canadian investors need to understand the value of compounding and how it can work in their favour. What this means in practice is that BTSX is just a workable methodology to be used in order to build up, over time, a portfolio of high-dividend paying, blue-chip Canadian stocks bought at a reasonable price. Let’s say you purchase an initial ten stocks; the next year several drop off the list, maybe some of them because the price has gone up, meaning the yield has gone down, but the price going up is a good thing! If you like the stock and have done your research there is no real reason to sell it. Rather, why not keep it as part of a long-term portfolio, DRIP the dividends into new shares, and let compounding work for you.
The final graph, Figure 3, is based on a suggestion from Jack Bogle, the founder and former CEO of the Vanguard Group. He says that in order to determine whether there are real practical differences between two data sets you should simply divide one set by the other and graph the result. Figure 3 convinces me that there is indeed a true advantage to the BTSX approach to investing. However, it also shows a big flaw; around the turn of the decade a large drop in the curve can be seen. At the time I was on the verge of abandoning BTSX until it dawned on me what had happened. The indices we deal with are market-cap weighted, meaning that the higher the share price and the more shares that are issued the greater weighting the company has in the index. Around 2000 Nortel’s share price was soaring until, at its highs, Nortel, which didn’t pay a significant cash dividend, represented more than 40% of the S&P/TSX 60 index. There was no way a BTSX portfolio could offset the Nortel effect, but after the stock crashed and burned (sadly leaving many investors and employees in the lurch) the problem solved itself.
David W. Stanley, Guelph, Ontario
Matt Poyner is a DIY investor based in Whitby, ON.
Ross Grant is the e-book Author of Destination: Early Financial Independence, available on Amazon and Kobo for $5.99. Free e-reader software is available for PCs, MACs, etc. to view the book. Please email Ross if you need the links. You can reach him at RossGrantEFI@gmail.com