
What Investors Need To Know About Benchmark Indices

A benchmark index is a standard group of investments that can be a useful tool to measure the performance of other investments. They are frequently referenced in the investment world.
For example:
The profile of a mutual fund on the Globe Investor website shows the returns of an “Index” alongside the fund returns;
The description of an exchange-traded fund (ETF) states that the ETF seeks to track the performance of [XYZ] Index after fees and expenses.
A newspaper article reports that the Canada Pension Plan Investment Board measures its performance against a market-based benchmark.
You have likely encountered benchmark indices, but do you really understand them? Who creates them? How are they constructed? How are they used? What makes a good benchmark index? What should you consider when assessing benchmark index data?
Financial services companies create benchmark indices. The major players in this space are S&P Dow Jones Indices, Morningstar Indexes, MSCI Inc., Barclays Indices and FTSE Russell. Such index manufacturers license their products for use in measuring investment performance, or as the basis for constructing exchange-traded funds, mutual funds and other investment products.
Indices have been developed for the main asset classes found in many investors’ portfolios—cash, fixed income, stocks, real estate—as well as other asset classes. Indices that incorporate multiple asset classes are also available. There are equity indices based on country, geographic region, style, sector, company size, dividend history, investment themes, or such factors as stock volatility. Bond indices may be defined by such aspects as issuer (government or corporate), investment quality, time to maturity or such factors as being priced below par. There are real estate indices delineated by geography, company size, volatility or yield, among other factors. And the list goes on.
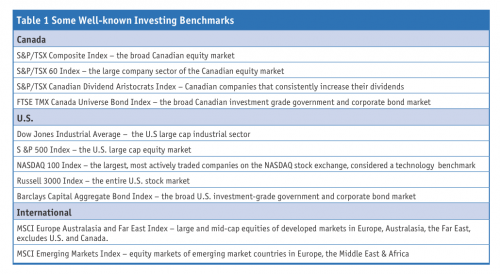
The number of benchmark indices that have been developed is well in excess of 160,000. Some of the most well-known ones are shown in Table 1. New indices are built regularly as investors’ needs evolve. For example, in January 2016, in response to the concern of large institutional investors regarding short-term thinking in the capital markets, S&P Dow Jones Indices launched the S&P Long-Term Value Creation (LTVC) Global Index.
But with so many indices available, how do you know which ones are worthwhile?
Characteristics Of A Good Benchmark Index
The characteristics of a good benchmark index from the point of view of an individual investor are listed below, along with an assessment of how one well-known Canadian benchmark index (the S&P/TSX 60 Index) measures up. (The information regarding this Index has been drawn from http://ca.spindices.com/indices/equity/sp-tsx-60-index.)
The index has a precise objective.
The S&P/TSX 60 Index from S&P Dow Jones Indices is designed to benchmark the large-cap market segment of the Canadian equity market.
The methodology used to build the index is comprehensive, transparent and objective, and produces an index with holdings that represent the intended objective.
The S&P/TSX 60 Index methodology is covered in the 34-page document, S&P/TSX Canadian Indices Methodology. The eligibility criteria for the S&P/TSX 60 Index are clearly explained. The index is a subset of the S&P/TSX Composite and has 60 constituents that represent Canadian large cap securities. Market capitalization, liquidity minimums and ineligible securities are defined. There are rules designed to match the sector balance of the S&P/TSX Composite. The process for determining the weight of each index constituent, modified market capitalization, is set out.
Given that investments which meet the eligibility criteria of virtually any index will change over time, there is a well-defined process for maintaining and rebalancing the index.
A committee reviews the S&P/TSX 60 Index constituents quarterly, and rebalances the index after the close of trading on the third Friday of March, June, September and December. As well, there may be ad hoc changes such as the removal of an index constituent which has stopped trading due a corporate takeover or bankruptcy.
The index construction methodology and the list of investments comprising the index are publicly available.
The methodology, constituents and sector breakdown of the S&P/TSX 60 Index are published on the index manufacturer’s website.
Index performance is clearly measurable. If an investment is difficult to value (e.g., private equity investment or a stock that trades infrequently), index performance could be difficult to measure.
The S&P/TSX 60 Index performance is measurable. All index members trade on the Toronto Stock Exchange and meet liquidity minimums.
The index has a track record. An index may tout theoretical performance based on returns which occurred before the index was launched, but actual data is more reliable due to hindsight bias in index construction.
The S&P/TSX 60 Index was launched December 31, 1998. More than 15 years of actual performance data is available for review.
The index is appropriate for the intended purpose.
If you wanted to benchmark the performance of your portfolio of large cap Canadian stocks, the S&P/TSX 60 Index would be a reasonable benchmark.
Methods of Index Construction
There are several approaches to constructing a benchmark index.
1. Market Capitalization-weighted Indices
Market capitalization was one of the earliest methodologies used to construct benchmark indices and is still in wide use. Investments are chosen based on criteria defined by the index manufacturer. The percentage of each investment is based on its market capitalization or market value (number of shares issued multiplied by the stock price). Rules may be set to modify this weighting (e.g. a limit on the weighting of any one index constituent).
Market cap indices tend to over-weight companies with large share issues and high share prices.
In the case of bond indices, the market capitalization is based on the dollar value of the bond issue. Therefore, in some bond indices, the most heavily indebted issuers end up being a larger proportion of the index. Given this, the credit quality of the debt is typically factored into the construction of a bond index through the use of minimum credit quality criteria.
Let’s investigate a well-known example of a market capitalization index: the S&P/TSX Composite Index. This index is intended to benchmark the broad Canadian equity market. Financial, energy and materials firms account for over 66%. The top three holdings are all huge Canadian banks. The market cap of the smallest index member is $385 million. Small Canadian companies and certain sectors of the Canadian economy are not well represented in this index.
A large constituent of a market cap index could be so heavily weighted that any price change would have a considerable impact on the index performance. To counter this, some indices impose limits on the size of any one holding. For example, the weighting of any one constituent in the S&P/TSX Capped Composite is capped at 10%.
2. Price-weighted, The Dow Jones Industrial Average (DJIA) Index
The Dow Jones Industrial Average is the grand daddy of benchmark indices: it was launched in 1896. The Index consists of thirty large, publicly traded American companies chosen by a committee based on company reputation, track record for sustained growth and public interest. The weighting of each constituent is based on its share price. This is not the best indicator of how the overall stock market is doing because each dollar change in any one company’s stock, no matter the size of the company, changes the Index by the same amount.
3. Equal-weighted Indices
Equal-weighted indices often use the same constituent selection methodology as other types of indices, but the weighting of the constituents is different. The signature feature of this type of index is that all holdings have the same weighting. This methodology overcomes some of the aforementioned shortcomings of market cap indices, although it can introduce other shortcomings such as higher trading costs to rebalance the index and higher weightings to smaller stocks.
Index suppliers have manufactured equal weight versions of some popular market cap indices, such as the S&P/TSX Composite Equal Weight Index and the S&P 500 Equal Weight Index. The Dow Jones Canada Select Equal Weight REIT Index is another example of this approach. It benchmarks Canadian-listed REITs, a popular way to invest in Canadian real estate assets.
4. Factor-based Indices
These indices use rules based on factors related to individual investments to determine the index constituents and their weightings. The intent is to improve on traditional market cap indices. These are sometimes called fundamental, alternative or smart beta indices.
One such approach selects index constituents based on financial characteristics. For example, the FTSE RAFI U.S. 1000 Index is composed of the top 1,000 U.S. listed companies chosen and weighted by their fundamental value. This is determined by evaluating four factors: total cash dividends, free cash flow, total sales and book equity value. The index is re-balanced annually.
Factors such as share price momentum have also been used in index construction. The Morningstar Canada Target Momentum Index includes 30 TSX-listed Canadian issuers that are selected based on above average return on equity, upward revisions on earnings estimates, and positive price momentum. The index is equally weighted and rebalanced quarterly.
Benchmark Indices And Exchange-Traded Funds
Most exchange-traded funds are based on a specific benchmark index which will be named in the fund prospectus and other descriptive material. The ETF objective is typically described along the lines of “seeking to deliver the performance of the [benchmark index], after expenses.” The ETF attempts to do this by owning the investments in the reference index in the same proportions as the index.
The earliest ETFs were based on well-known benchmark indices such as those listed in Table 1. The recent trend is for an ETF supplier to ask an index manufacturer to build an index tailored to her vision for a new fund, and then launch an ETF based on the new benchmark.
Some ETFs fully replicate their benchmark indices (i.e., own all the members in the index). ETFs which are based on indices with many constituents may use statistical sampling to select a subset of constituents that the ETF will actually own.
Prospective ETF purchasers should confirm that an ETF of interest is based on a good benchmark index, as described above. If an ETF uses statistical sampling, the ETF’s performance should be checked to confirm that it does indeed track its benchmark index.
Assessing Portfolio Performance Using Benchmarks
Benchmark indices can be used to evaluate the performance of your portfolio. Given the volatility of some investments over the short term, benchmark indices are more appropriate for evaluating longer term (at least a year) investment returns.
One important thing to remember about benchmark indices is that the published returns do not include the management fees, trading costs or administrative expenses involved in managing a portfolio. Your portfolio is likely to underperform its benchmark index due to these costs.
To gain a realistic measure of performance, your portfolio should be compared to a well-constructed benchmark that reflects the investments you own. Your financial advisor or brokerage firm may be able to provide what you need. You could check out the returns of various indices at the websites of index manufacturers. A reference benchmark index may be published on your investment account statement.
If you are unable to find an appropriate benchmark index, you may be able to create a customized one using indices for each of the asset classes in your portfolio. For example, say you own a portfolio that is 20% Canadian large cap equities, 20% U.S. large cap equities, 20% developed equities outside North America and 40% Canadian bonds and you want to assess its performance over the last five years. To create a suitable benchmark index, you would tally up 20% of the 5-year return for each of the following indices: S&P/TSX 60 Index, the S&P 500 Index and the MSCI Europe Australasia and Far East Index, and then add 40% of the 5-year return of the FTSE TMX Canada Universe Bond Index. The asset mixer at fellow Canadian MoneySaver writer Norm Rothery’s website (www.ndir.com) will do the math for you.
Personal finance writer, speaker and teacher Gail Bebee is author of No Hype - The Straight Goods on Investing your Money, now in its third edition. Visit www.gailbebee.com