Harnessing The Power Of Market Sentiment
 In my last article, “How Sentiment Shakes the Market,” we saw that when one buys a share of a company, one is not just paying for whatever net assets the company has but also a premium for the market’s feelings, or sentiments, towards that company. As we saw, a public company is not just a profit machine but also a capitalization machine.
Paying “extra” seems unfair but unfortunately it is a fact of life and can only be partially avoided if we buy a stock when the market has bad feelings towards it or about stocks in general.
“Net assets” are the assets on the company’s balance sheet less all the liabilities. This is an important metric, but not a perfect one. Warren Buffett, for example, uses net assets as a proxy for “intrinsic value” but he says that this is so only because he cannot find a better measure.
As value investors we also know one other very important thing about net asset value per share, and it is this: if you buy a company’s share in the market at or below net asset value per share, you are most likely to do well, once a premium develops, as long as the stock you buy is a going concern and will continue generating profits – in other words, if you don’t get yourself snared by a “value trap.”
One way to pick stocks, therefore, is to look for companies which are trading at a value close to net asset value per share, preferably also with low price-earning ratios and low price-to-cash flow per share, and once you have a short-list of such stocks, to assess their profitability, dividend distribution culture, and, most importantly, their business model, before you buy them – this last factor was the subject of the first article in this mini-series.
Buy when sentiment is low, and sell when sentiment is high.
Two Levels
Low sentiment comes at two levels. The first is low sentiment about a particular company’s prospects and the second is low sentiment towards the whole market.
At the first level, therefore, you have a stock which is out of favour, not necessarily because it is a bad profit machine, but just because the market considers the stock dull, with few growth prospects, that it is “going nowhere.” Between 2003 and 2012, the prime example might have been Microsoft (MSFT).
At the second level, we have investors shunning the market in general—yes, think 2008/2009.
Not all portfolio managers agree with what I am going to write next, but I think that the second type of bad sentiment produces the greatest opportunities to make money.
When markets fall steeply—and then start to rise—they provide us with providential opportunities. Take your pick of blue chip, large, dividend-paying stocks and shoot at them in a barrel. The only problem with this investment approach is that such terrific opportunities come round only once or twice every generation.
The main worry with the first level of bad sentiment, which is of course that you may be buying a lemon, does not really come into play at the second level where there’s usually acute fear and everything is on sale at terrific bargains. This has been called “blood in the street” investing. The only way a market will stay down—or even just cease to exist—is if there is a big, fundamental change in the way society and markets are organized, for example, widespread expropriation of private property under an extreme political regime. In that case, of course, the market in what you own is unlikely to recover during your lifetime.
Gauging Sentiment
Like Scrooge’s ghosts, sentiment is not only elusive but quite ephemeral, and this fleeting nature of sentiment compounds the problem of harnessing it to our own material ends.
How do we recognize the signs of sentiment? Various ways have been tried, and the subject is now becoming quite popular.
The first thing that comes to mind is to do a survey of market participants.
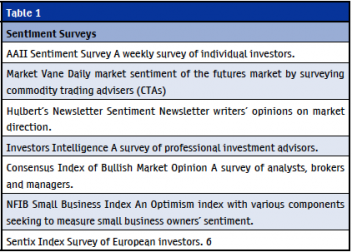
 Table 1 provides a brief list of the more important surveys of market sentiment, all of which have quite a lengthy track record.
All surveys are necessarily backward looking. And no survey is perfect—some suffer from too narrow a base, others from the way they collect and interpret data, while others are too susceptible to manipulation, and yet others are published simply to manipulate. So, in general, the more surveys you look at, the better you understand what’s happening to market sentiment.
A major problem with sentiment surveys is that even honest respondents may not know their true feelings and that, even if they knew, their sentiment towards the market may be quite variable. The same respondent may answer one way if he just arrived at the office and in quite another if the survey is the last thing on his in tray after a hard day’s work. Studies have shown that hormones play an important part as well and affect the way we see the world around us.
Recently, surveyors have turned to the social media, especially Twitter, to gauge sentiment. They measure, among other things, how often a particular company is mentioned, and the sentiment level of words used in the same message as the company name. They also count the number of generally optimistic and pessimistic words in messages of a general nature in order to try and gauge feelings.
These are interesting approaches but one has to keep in mind that social media are notoriously vulnerable to manipulation—for example, if you want to increase the number of “followers” on Twitter you can easily find a service which sells them to you by the hundreds. I am quite sure that one can quite easily generate thousands of positive sounding messages about a company or the market in general to fool the surveyors and manipulate the market so that, for example, one’s IPO does well. I therefore suggest you interpret results of surveys very carefully, and a good pinch of salt doesn’t hurt.
Market Metrics
If the market captures sentiment and is a sentimental machine, why don’t we try and measure sentiment by measuring what’s happening in the market? This is precisely what market indicators attempt to do.
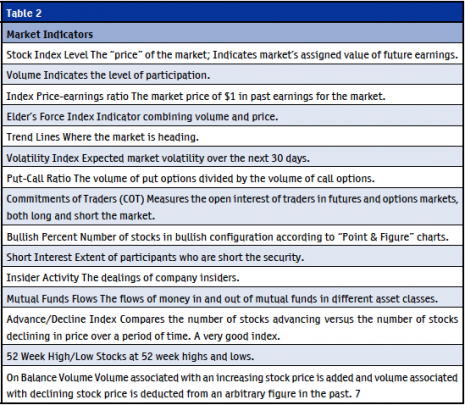
Table 2 shows a number of popular market indicators, most of which can easily be calculated by most charting or market information software.
Market indicators do provide insight into the market’s sentiment level, but they are only proxies for sentiment. Their strength lies in being derived from market action and therefore being up-to-the-second.
Sometimes, though, a set of indicators move abreast for a long time only to start contradicting one another when you need them most!
Useful
Among the most popular and useful surveys is the one published weekly by the American Association of Individual Investors (AAII). The AAII polls its thousands of members as to whether they are bullish, bearish or neutral on the stock market over a six month time horizon. The results are published on the AAII’s website at http://www.aaii.com/SentimentSurvey. On the website, the AAII also provides historical data and shows you how you can vote once you become a member. Quite apart from the survey, this is an excellent site containing many good articles which should appeal to the individual investor.
I have been following the survey for a number of years and I find it to be one of the most valid. I assess the data provided in various ways but mostly by observing the market from week to week and seeing the reaction of AAII members as expressed in the survey to what is happening in the market.

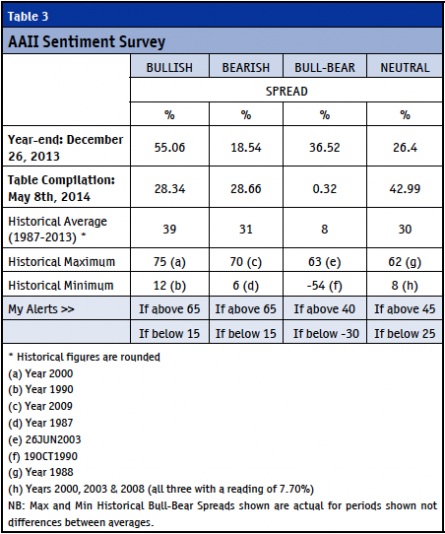
Table 3 shows the Bull, Bear and Neutral percentages as at the end of 2013 and at the time of writing. I also calculate a Bull-Bear Spread % by finding the difference between the Bull percent and the Bear percent. This differential is my main gauge.
You can see how much more bullish AAII members were at the end of last year versus today. The Bull-Bear Spread % was 37% back then, but is nearly 0 now. However, one should not read too much into these numbers since sentiment is very fickle.
Extreme Prices
In the second part of Table 3, I show historical averages, maximums and minimums for all the three main sentiments as well as for the Bull-Bear Spread % so that you can get a good idea of where the extremities lie, even though, here too, past performance is just an indication. This is one way I analyze the data.
Even in the Great Financial Crisis of 2008/2009, the market did not go past the 70% mark in bearish percentage while there were only 8% Neutral respondents. On the other hand, individual investors were most bullish in the year 2000, floating on the Dot-Com bubble.
Importantly, the Bull-Bear Spread %, which I calculate regularly, reached its peak of 63% at the end of June 2003, just before the market took off in its great run towards the Great Financial Crisis.
The Bull-Bear Spread %, conversely, hit a low of -54% in mid-October 1990, after two months of sharp falls in the market; after that extreme value came ten years of market rises, until the dot-com crisis.
In my experience, any time the Bull % or the Bear % go above 65% or below 15% or the Bull-Bear Spread % goes above 40% or below -30% is a time of extremely high or low sentiment and usually precedes an important turning point in the market. Extremes are alerts for one to start watching the market really closely, and to plan for action. Often, whether to buy or to sell, depends on sentiment.
Also Watch…
While the AAII survey is important and adds important information, one has to watch other indicators to get a broader picture.
You have to watch what insiders are doing: is the ratio of share sales to share purchases increasing or decreasing? Are IPOs increasing in number or volume? Have companies been issuing a lot of shares? Have companies been issuing a lot of junk debt? Is there a lot of merger and acquisition (M&A) activity going on?
Keep in mind that insiders usually have much better information about their company than outsiders and when they are anxious to sell you a piece of the pie it usually means that both sentiment and the market are sky high and that the pie is close to its “best before” date.
What are other investors in the market doing? In which direction are mutual fund and ETF flows going? Are closed-ended funds trading at a high or at a low discount to net assets? What is the yield on bonds versus the yields on equities?
Importantly, you have to look at the market itself for factors such as those listed in Table 2 and understand the market’s cues and intimations. Usually, no one thing, no single metric, works perfectly as an indicator of what is to come, but if you notice that various things are pointing in the same direction, you’re likely to be detecting more than a mere coincidence.
Paul V. Azzopardi BA(Hons)Accy, MBA, FIA is a Portfolio Manager and an Instructor at the School of Continuing Studies, University of Toronto, where he presents the “Choosing Income Investments” course in the Fall at the Mississauga campus and in the Spring at the St. George, Toronto campus.
The opinions expressed here are not investment advice and are solely Paul’s and not those of his employer/s. The mention of securities is only by way of example, and not a solicitation to buy or a recommendation to sell.

