
Three Stingy Stocks For 2015
 The Stingy Stocks got their start in Canadian MoneySaver way back in 2001. The idea was, and still is, to try to beat the S&P 500 Index by picking value stocks from within the Index itself, using a simple numbers-based approach.
It's worked well so far because the Stingy Stocks have gained 15.2% per year on average since 2001. By way of comparison, the S&P500 (as represented by the SPYETF) advanced only 6.5% a year over the same period. The Stingy Stocks bested the index by an average of 8.7 percentage points a year. You can see the full performance record in Table 1.
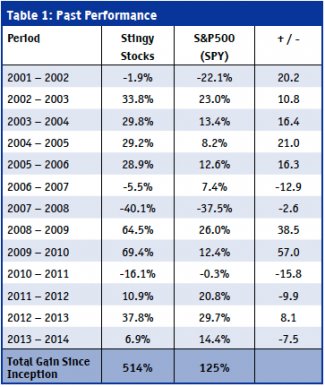 The long-term numbers are excellent, but they come with a few ups and downs along the way. For instance, last year wasn't great. The Stingy Stocks gained 6.9% since last time while the S&P500 (SPY) jumped 14.4%. That's a poor relative showing, but such periods have to be expected from time to time.
How Are The Stingy Stocks Selected?
I look for companies that are both cheap and relatively safe, which is an uncommon combination.
On the bargain front, I like stocks trading at price-tosales ratios of less than one. Typically only a few stocks pass the test and this year was no exception.
Cheap stocks are great but I also want some assurance they won’t go bust. That's why I stick with firms within the S&P 500, which tend to be large and relatively stable. But that isn't a guarantee.
Because size is an insufficient measure of safety, I also look for companies with little debt and lots of assets. Such firms are stronger than companies perched precariously on piles of IOUs.
Three ratios are useful when searching for companies with little debt. Perhaps the most important is the debt-to-equity ratio, which is calculated by dividing a company’s debt by its shareholders' equity. The amount of debt that a company can comfortably support varies from industry to industry but debt-to-equity ratios of more than 1 can be too high. I prefer very conservative companies with debt-to-equity ratios of 0.5 or less.
The next balance sheet figure to consider is the current ratio, which is calculated by dividing a company’s current assets by its current liabilities. Current assets are assets (such as receivables and inventory) that can be turned into cash within the next year. Current liabilities are payments that the company must make over the next year. Naturally, an investor would like a company’s current assets to be much more than its current liabilities, and I prefer companies with current assets at least twice as large as current liabilities. After all, you can be pretty sure that a firm’s creditors will demand prompt payment of the current liabilities. On the other hand, some current assets, such as inventory, might not turn out to be worth as much as expected.
Finally, a company’s earnings before interest and taxes should be large in comparison to its interest payments. The ratio of earnings-before-interest-and-taxes to interestpayments is called interest coverage and I like this ratio to be at least two or more.
While the debt ratios I’ve selected are useful in determining a firm’s ability to shoulder debt, they are not perfect. For instance, some long-term obligations may not be fully reflected on a company’s balance sheet and are, sensibly enough, called off-balance sheet debts. Regrettably, off-balance sheet debt can be a source of considerable consternation. Things like unexpected legal liabilities can sideswipe what might otherwise be a good investment. That’s why, as with all screening techniques, you should embark on a more detailed investigation of each stock before making a final investment decision.
Continuing the safety theme, I also want a company to show some earnings and cash flow from operations over the last year. After all, a business is less likely to go bust when it is profitable and has cash coming in the door.
That’s a daunting list of requirements and I’ve summarized the primary factors in Table 2.
Last year the method uncovered only three stocks. The same number of stocks were found this year, but the names have changed since last time. The small number of candidates indicates that bargains remain relatively scarce. It also suggests that the market is fairly extended at the moment.
 Details on the three stocks for 2015 are shown in Table 3 where you can see each stock's dividend yield and multiple of sales (P/S), earnings (P/E), and cash flow (P/CF).
It is important to point out that most investors should own more than three stocks. I do. Ten might be considered to be a bare minimum and twenty is a more reasonable number for most investors.
I hope the method piques your interest. But be sure to fully investigate each stock before investing. The Stingy Stocks might be relatively safe, but there is no such thing as a risk-free stock.
Norman Rothery, PhD, CFA, Founder of StingyInvestor.com, Toronto, ON (416) 243-9580, rothery@stingyinvestor.com, www.stingyinvestor.com