

Fallen Angels
 Click Here to view Keith's comments on his article "Fallen Angels"
For those who like to look at stocks and sectors that have been out of favour (yet are showing signs of turnaround) this article might offer some starting points for exploration. I’ve listed a number of “fallen angels” that appear to be technically improving. This list is by no means extensive—it’s just a handful of candidates that appear to be turning around.
Please note that I don’t hold positions in any of the stocks listed, as we at ValueTrend haven’t done enough fundamental analysis to endorse them at this time. I’m simply observing some stocks that appear to be setting up technically, with a focus on former underperformers.
While there are always lots of fallen individual stocks, industry sectors, or country indices we can look at, I am looking for those that show at least some potential for forming a traditional “Phase 1” consolidation, and hopefully an eventual breakout. For more information on understanding market phases, I’d recommend you read my book, Sideways Using the Power of Technical Analysis to Profit in Uncertain Times.
Below are a few charts that illustrate the beginnings of a base breakout. These are not necessarily “buy” candidates – view most of them more as “watch” candidates for your list. I’ve made a few notations with the charts presented.
Emerging Markets: No Longer Submerging?
The iShares emerging markets ETF (EEM-US) shows us that the recently “submerging markets” may be trying to put in a bottom at this time. A potential head and shoulders bottom—missing the right shoulder—may be in play. A rally through the neckline at around $35.50 may be a bullish sign. A “bullish cross” (50-day MA moving up through the 200-day) occurred on this ETF recently. Further, sentimentrader.com notes that investor sentiment is getting overly bearish on this index. That’s usually an early heads-up on a potential turnaround story.

Britain: Tickety-boo Again?
“Brexit” has been in the news lately, pushing the United Kingdom’s index down. Some signs of the stress abating has given the index a little relief recently. The iShares UK ETF (EWU-US) has broken its one-year downtrend, but needs to cross about $16.25 to suggest a successful Phase 1 bottom breakout.

Pharmaceutical Sector Returning To Health?
The pharmaceutical (DRG chart) sector index has broken a 1-year downtrend but remains below its 200-day MA and below a key technical resistance point at around 525-530 on the chart. A breakout would imply lots of upside for this sector—resistance targets of 550, 570 and the old highs of 610 are possible. Keep an eye on this one.
Natural Gas Stocks About To Pop?
The XNG Arca Natural Gas Index suggests a Phase 1 bottom is in the works. A move above 575 resistance would verify the bullish Moving Average crossover.
Airlines: Ready For Takeoff?
A consolidation pattern between 200 – 260 has been in place for this US Airlines index since early 2015. Currently, the airlines index is caught in a tight trading pattern. It appears that the index is bouncing off of that significant support level at around 200—a bounce to the top of the pattern would seem possible. Here in Canada, we can also see some signs of improvement in Air Canada (AC-T) and Westjet (WJA-T), as they break through 1-year downtrends—charts not shown. This is a sector worthy of consideration on both sides of the border.

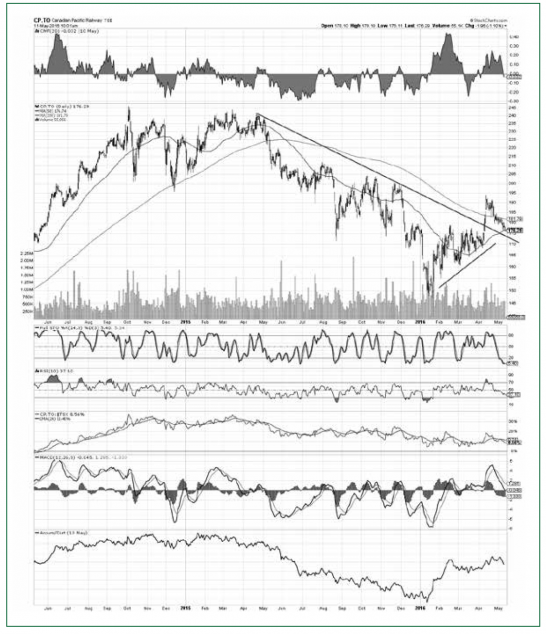
CP Rail Back On Track
CP Rail has felt the heat of reduced coal and oil shipments (pardon the pun). The stock has been struggling to stay above its 1-year downtrend. However, a recent peak of $190 took out the last peak(s) of $175, and the stock has had a few successive higher lows. Momentum studies are oversold. So long as $175 is held and the stock can rally off that level (or close to it), I’d say it looks technically interesting.
Manulife Coming Back To Life?
Old support on this Canadian stalwart at $19 has become near-termed resistance. A breakthrough $19/ share for MFC-T would imply a $22-23 target. That’s a reasonable, although not overly exciting, gain. But it’s supplemented by a 4% dividend, making the package a bit more enticing for investors. The recent rising troughs are encouraging, but don’t buy the stock unless it breaks out through $19.
AG Growth Ready To Sprout?
The farming industry in Canada has been under pressure, and this grain processor has felt that pain. AG Growth (AFN-T) seems to be breaking a neckline at just over $36/sh. Momentum studies suggest waiting to see if this level can hold before considering a position in this stock. However, a move through $40 would be technically encouraging.
Element Financial (EFN-T)
I couldn’t think of any snappy sub-titles for Element Financial’s turnaround potential, but this financing company looks to be showing early signs of breaking its 12-month downtrend. A symmetrical triangle breakout has taken out the last peak while demonstrating higher lows since February. Moneyflow is improving slightly, while short-termed momentum is overbought at the time of writing. A break above $16 would imply a return to its old highs of around $20/share.

Keith on BNN's MarketCall: Wednesday July 13, 2016 at 6:00pm
I’m doing the afternoon MarketCall Tonight show on Wednesday July 13th from 6:00PM – 7:00PM. Call in with your questions during the show’s live taping between 6:00 p.m. and 7:00 p.m. The toll free number is 1-855-326-6266.
You can also email questions ahead of time to marketcall@bnn.ca – it’s important that you specify they are for me.
Keith Richards, Portfolio Manager, can be contacted at krichards@valuetrend.ca
Keith Richards may hold positions in the securities mentioned. Worldsource Securities Inc., sponsoring investment dealer of Keith Richards and member of the Canadian Investor Protection Fund and of the Investment Industry Regulatory Organization of Canada. The information provided is general in nature and does not represent investment advice. It is subject to change without notice and is based on the perspectives and opinions of the writer only and not necessarily those of Worldsource Securities Inc. It may also contain projections or other “forward-looking statements.” There is significant risk that forward-looking statements will not prove to be accurate and actual results, performance, or achievements could differ materially from any future results, performance, or achievements that may be expressed or implied by such forward-looking statements and you will not unduly rely on such forward-looking statements. Every effort has been made to compile this material from reliable sources; however, no warranty can be made as to its accuracy or completeness. Before acting on any of the above, please consult an appropriate professional regarding your particular circumstances.