What History Can Teach Us About Upcoming Market Trends
In my last column, I wrote about the potential for a sideways market emerging after the current bear trend ends, rather than the emergence of a new bull market. In this column, I will expand on the concept of a sideways market and cover potential investment opportunities that can come out of such market cycles.
If History Repeats Itself
If history repeats itself, then the current bear market phase might end and be followed by a nice rally back to its old highs of around 4800 for the S&P 500. In the past, we have often seen major bull markets end with big bear markets. These bear markets can then end up rallying right back to the old highs. From there, they either fail or retrace their rally. This creates a "sideways market." Conversely, if the market breaks through its old highs, they have confirmed they have moved into a new bull market.
Now, this is the important part: If we are currently in a sideways market, a rally to 4800 on the S&P 500 will not be breached by much, if at all. However, if 4800 is breached, we are back to the bull market. It's as simple as that! A sideways era is characterized by rising markets to a ceiling, as noted on the S&P 500 chart at the bottom of page 19 in this report. Markets rise from depressed levels, only to fail again. A bull market, on the other hand, is recognized by new highs.
Historically, as you would have seen in my prior column, stock markets have seen several sideways markets, where no new highs occurred for many years. Some of these sideways periods saw several short up/down moves, such as during the 1965-1982 sideways period. The last sideways market saw only two large bull/bear moves. They occurred in 2001, then 2008, where both bears ended and rallied strongly back to similar highs and failed. Again, a sideways period on the charts.
We can't predict if the current bear will rally to its previous highs of around 4800 on the S&P 500 and fail. But, if it does, that might suggest a repeat of the historic sideways up/down swing patterns that can last for more than a decade.
If a sideways market happens, we can rejoice. There is money to be made in such an environment, even for index investors. We can swing-trade the market. I teach this method in my Online Technical Analysis Course. Using The Power Of Technical Analysis in Any Market (thinkific.com)
Let's assume that markets do, in fact, go into another prolonged swing-pattern sideways market with a defined lid. Because these patterns have historically lasted more than a decade, the earliest that we might expect an end to the sideways period and a new prolonged bull market to emerge would be in the 2030s. Again, this is not a prediction; It's a "what-if" scenario. This scenario is only valid if the historic pattern for periodic sideways markets repeats. That is if the S&P 500 fails to break 4800. Note that the recent bull market has been around for only eight years. This will be a historically short bull market if we do enter a sideways period.
It's yet to be seen if we do, in fact, enter a consolidating market or if we see a continuation of the bull market.
Profiting In A Sideways Market
Let's imagine that the market does move sideways for several years. Money can be made during the enormous swing patterns in a sideways market. The chart below provides a simple example of trading these swing patterns. More information on this strategy is available via Keith's online course noted above.
In a nutshell: Wait for the current bear to end via peak/trough base analysis. Buy on confirmation of a base breakout. Play the upside once again as it returns to the old highs. Sell if the index fails to break through the old highs. Repeat.
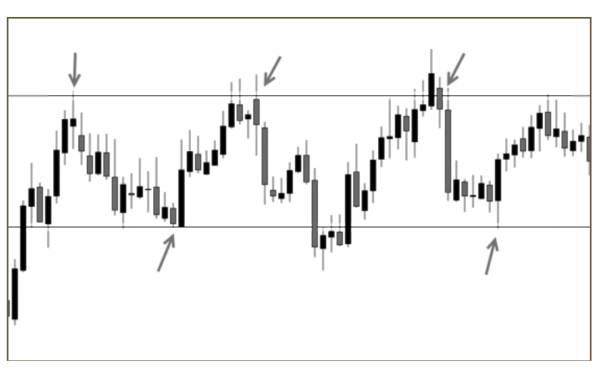
There's another way to make money in a sideways market. This opportunity comes from the potential re-capitalization within the popular stock indices such as the S&P 500 and the TSX 300. To understand what this means and how this might happen, resident Fundamental Analyst Craig Aucoin at ValueTrend offered his view of the potential market patterns from his perspective.
Fundamental Overview
Standard & Poor's Corporation first developed industry-wide stock price indices in 1923 and three years later came up with the Composite Index, which contained 90 stocks. The Composite Index became 500 stocks on 1 March 1957 and was renamed the S&P 500 Index. The composition of the original Index contained 425 industrials, 25 railroads, and 50 utility firms. Not until 1976 were 40 financial stocks added, and a portion of the other groups reduced. This Index of 500 stocks is continually updated and adjusted.
We draw attention to the evolution of the Index to point out that not only is the changing composition important, but also how it relates/ interacts with where and how the market is valuing various sectors at a particular point in the economic cycle. The chart below illustrates some historical evidence of how weightings change over time.
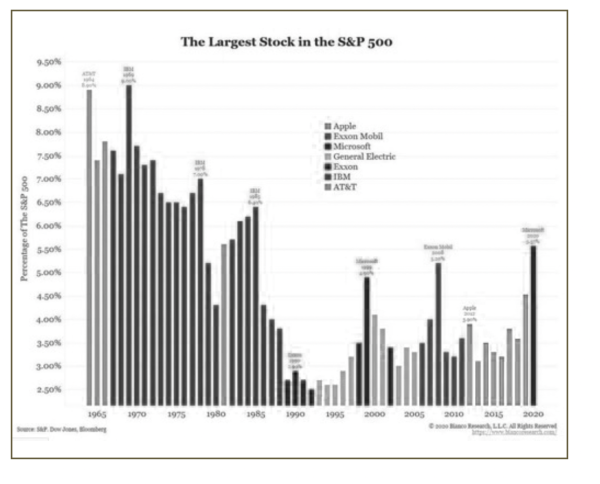
How we determine a multiple to put on the market's (defined by S&P 500) earnings at a particular time must be adjusted/ adapted to the composition of the Index at that time. Should it not be?
An example of the Index in 1957 is not the same as in 2003 or for that matter, 2022. Saying that historically the earnings multiple of 15x is cheap may be the case, but cheap on cyclical earnings of a railroad is different from cheap on earnings of an online retailer.
During the 1990s, the returns of the S&P 500 were heavily influenced by Information Technology components. Many new entrants in the late 90s, such as WorldCom, Global Crossing, and Qwest, entered the Index and subsequently underperformed the average. In fact, WorldCom and Global Crossing were deleted less than ten years after they were added. By June of 1999, WorldCom constituted over 16% of the sector's market value. What followed is commonly regarded as the tech crash. Despite the huge success of firms like Intel, Microsoft, Cisco, and Dell, the drag from the addition of overpriced technology firms significantly hurt the performance of this important sector and, by extension, the entire market/Index.
We are not suggesting that the environment today is the same as in 1990. However: The strong contribution of the FAANG (Facebook, Amazon, Apple, Netflix, and Google) over the recent past to the S&P performance can not be ignored. From 2005-2013 Facebook, Amazon, Netflix, and Google were added, and the movement in the Index has been nothing short of parabolic.
Typical value stocks/ sectors tend to have lower valuations and multiples applied to them compared to high-growth sectors. (Example: FAANG). When a multiple is applied to an index, it is / should be thought of as different valuations for the different components/sectors consolidated within the index. This is much the same way an analyst might value a company that has several diverse businesses.
As this overvaluation cools, the market may return to valuing companies more moderately. When/ if this happens, the earnings will get a lower or higher multiple. As the environment changes, it may be that an energy company with proven assets in North America deserves a higher multiple than it has achieved in the past. The market may be more inclined to appreciate/ value a company in North America than one in a developing region of Asia. This scenario could justify/explain applying higher multiples to typical value sectors like Energy/Commodities, Consumer Staples, Industrials, and Materials. Perhaps the discretionary and information tech get a relatively lower multiple than in the recent past.
The FAANG stocks may not deserve nor command the high multiple of the recent period. As the environment changes, this may present a period of consolidation as the leadership and composition of the Index/market adjust.
This happened in the past during the 90s when IT was first meaningfully added, and also in the late 70s when oil service stocks were admitted to the Index.
Profiting As Indices Rebalance
In a nutshell, we view the potential for upside if, as, and when market composites move from their former overweight sectors (technology and growth) into new sectors to reflect new rotations. As large portfolio managers and Index Exchange-Traded Funds (ETFs) readjust their portfolios to reflect the rotations, the upside can be amplified. The trick will be to overweight our own portfolios as we witness a rotation into the sectors ahead of the Index rebalancing. The signs of sector rotation and how to trade them are discussed in Keith's Technical Analysis Course, noted above. ValueTrend employs this methodology within our Equity Platforms. This sector rotational strategy has been profitable for our platforms during the recent move from growth stocks to commodities and low beta stocks.
Sideways Markets Are Not Influenced By Price/Earnings (PE) Ratios
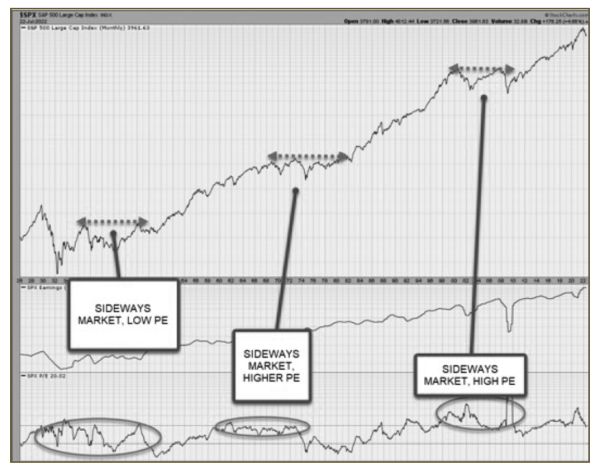
Many investors focus on index Price/Earnings (PE) ratios. As described above, index composition changes over time, distorting the ability to rely on PE ratio levels as a predictive model. Below is a chart of the three major sideways patterns noted above as seen on the S&P 500. Note that PE ratios had less influence on the macro consolidating patterns than you might suspect. The three eras of sideways markets experienced relatively differing PE ratio tendencies. They varied from low, high, and very high PE ratios with no historic relationship between the sideways market phases.
Other Factors
Here is a quick list of other possible factors that could influence a prolonged sideways choppy market for the next number of years:
- The end of the long-term secular decline in interest rates.
- Instantaneous access to financial information at a level never seen in history. The information available to the investing public leads to more violent stock price movements.
- The time that it takes for index leaders such as the S&P and Dow Jones companies to re-weight their benchmark indices. In this case, from technology to the next market leaders (commodities?). This may create a period of swing patterns.
- The hesitation on the part of the business to make significant capital investments due to a wave of fiscal conservatism resulting from a present and upcoming period of stagflation (rising inflation, lower economic output).
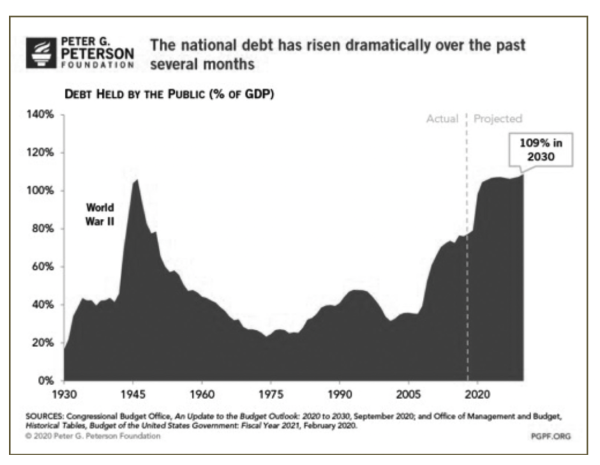
- Levels of consumer, corporate, and government debt per capita not seen since WWII. This can constrain consumption if rates rise. The chart below, using data to 2020, has been accurate so far.
- The effect of baby boomers cashing OUT of equity-based investments as they realize the effects of negative market behaviour on their plans for retiring.
- A reduction in confidence in the equity markets by the investing public due to disillusionment with the rates of return achievable through equity investments.
Where Will The Next Rotation Be?
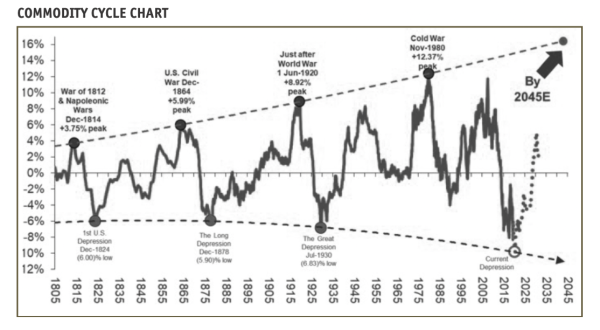
While we will not stick our necks out too far in predicting the next re-weighting strategy for the index companies, there may be an argument for the commodity space. Commodities have only recently been an outperforming sector, and there is an argument that they will eventually become one of the new higher weightings within index capitalizations. The chart below, courtesy of livewire.com, predicted the commodity rise after the 2020 COVID crash. It suggests more room to go. That would influence index weightings. A self-fulfilling prophesy one might say.
Conclusion
The argument for a new bull market era is viable once the current bear market completes its cycle. Or, perhaps a prolonged sideways market may be a reasonable alternative to anticipate. No one knows. As investment icon Howard Marks says: "You can't predict. You can prepare!" Our main objective in this paper has been to encourage readers to adopt a disciplined, objective buy/sell system for the equity portion of their portfolios. Or employ ValueTrend to do it for you.
If we witness a flat market trend with a ceiling at the 2021 highs, then investors must become far more proactive if they are to earn better-than-average results. Of paramount importance will be the need to "rise above" the herding instinct and incorporate a new level of discipline into your asset allocation and trading system. That discipline should incorporate a sector rotation strategy to beat a lower performing return from passive index investing, should markets trend sideways for a period. Similarly, one should adopt a swing trading strategy using index investments as described in this paper.
The most profitable investors in the potential current/future market environment may be those who, instead of maintaining a buy-and-hold stance, are willing to make both buy and sell decisions according to a proven system, such as that offered in Keith's Online Course or ValueTrend's portfolio management services.
Keith Richards is Chief Portfolio Manager & President of ValueTrend Wealth Mgmt. He can be contacted at info@valuetrend.ca. He may hold positions in the securities mentioned. The information provided is general in nature and does not represent investment advice. It is subject to change without notice and is based on the perspectives and opinions of the writer only. It may also contain projections or other "forward-looking statements." There is a significant risk that forward-looking statements will not prove to be accurate and actual results, performance, or achievements could differ materially from any future results, performance, or achievements that may be expressed or implied by such forward-looking statements, and you will not unduly rely on such forward-looking statements. Every effort has been made to compile this material from reliable sources; however, no warranty can be made as to its accuracy or completeness. Before acting on any of the above, please consult an appropriate professional regarding your particular circumstances

