
Building The Balanced Portfolio That Worked A Little Harder Through The Last Two Corrections - Part 2
 The Asset Scorecard is where we left Part 1 of this article in the March/April edition of Canadian MoneySaver. Now, in Part 2 we’ll look at ETF assets and run the portfolio through the last two major market corrections.
Asset Scorecard
- Canadian Stocks
- US Stocks
- International Developed Market Stocks
- International Developing Market Stocks
- REITs (Domestic and International)
- Canadian Bonds
- US Bonds
- International Developed Market Bonds
- International Developing Market Bonds
- Gold
International stocks now include developing markets.
International bonds now include developing markets.
You may decide to keep your U.S. bonds as well. I’d certainly be a fan of that, especially those U.S. treasuries. Just as with stocks, you may choose to own the world of bonds.
Got Gold?
Gold is often an unloved asset class. Of course, it can do nothing, or be a drag on your portfolio for decades. That’s often the nature of insurance. And then, it can deliver crazy returns such as 25% a year or more as it did in the 1970s when not much else was working against inflation. Remember stagflation?
To see the chart below live, I invite you to go to macro trends and have a look at the long-term performance of gold – https://www.macrotrends.net/1333/historical-gold-prices-100-year-chart.
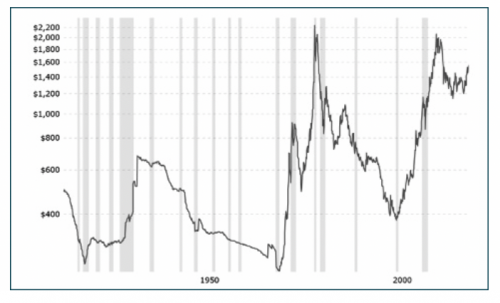
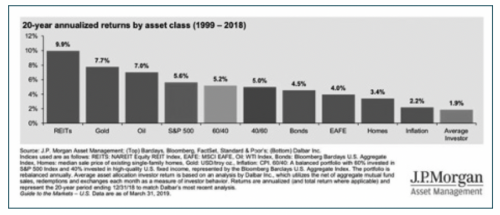
What also may be surprising, is that over the last 20 years or more the two best performing asset classes are gold and REITs. That 1-2 punch is largely missing from couch potato portfolios.
It’s interesting to look at the chart for asset returns on the next page for the 20-year period to 2018 as it includes the move through the last two major stock market corrections. The picture for gold has become even more favourable when we include 2019 and 2020 returns. Gold is now flirting with its all-time highs.
Here’s what happens to a portfolio when we simply add U.S. REITs and gold, global bonds and developing market stocks over the last 20 years or more, moving through the last two major market corrections. The chart is courtesy of portfoliovisualizer.com.
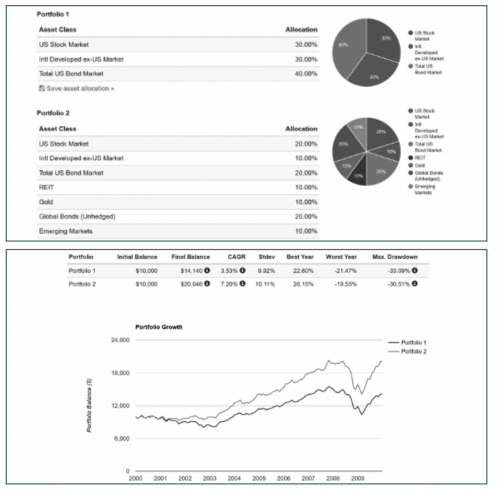
We’ll compare the portfolio of greater assets to a traditional balanced portfolio.
The 2000s was a U.S. tech dot-com bubble. The 2008 market correction was the U.S. inspired financial crisis.
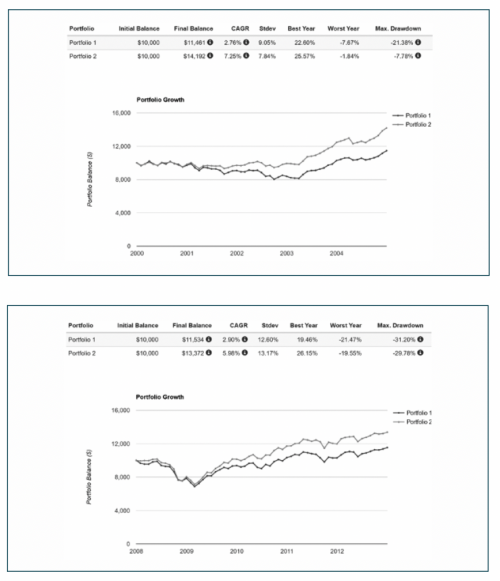
Here’s the portfolio comparison through the first correction:
And through the financial crisis.
Certainly, the greater Balanced Portfolio goes two for two. But there were assets that did not work very well in the financial crisis, such as developed and developing market stocks. REITs were hit hard in 2018 given the real estate roots of the financial crisis.
However, all put together and rebalanced on an annual schedule it delivered greater returns with a lesser portfolio drawdown. It might be incredible that most of us do not take the last two stock market corrections into account when we design our portfolios.
And What About Changing Economic Conditions?
Are we all suffering from recency bias? We might call it economic recency bias. Perhaps we’re only building our portfolios for conditions that we understand such as robust to tepic economic growth and muted inflation. What if long hair and peace signs and hippies and the stagflation of the 70s arrives in a VW camper van?
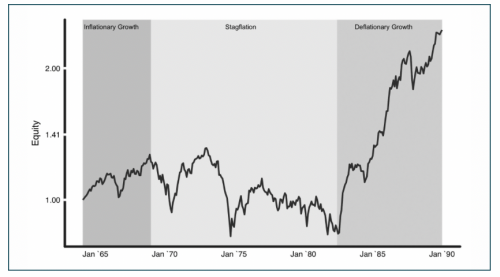
This graphic from ReSolve Asset Management shows that the Balanced Portfolio did not work in the period from the 70s into the early 80s.
And what about a severe deflationary period. Should we worry about this “stuff?” And what would it take to defend against these other “economic regimes?”
I’ll be back in the next edition of MoneySaver with a look at building your portfolio for the greater unknowns.
Thanks for reading.
Dale Roberts, Chief Disruptor at cutthecrapinvesting.com.
Disclosure: Keep in mind this article does not constitute investment advice. Please do your own research and know all risk and tax consequences.