
Zen, and the Art of Investing in Emerging Markets
 The great thing about technical analysis is that it is dynamic. If you read my MoneySaver articles or blogs regularly, you will know that I really don’t like “thematic” opinion-oriented investment theories. Too many investors formulate a thesis on market directions—bullish or bearish. Instead of forming an investment thesis or bias, I believe you are better to be “one with the market”. In that way, you have no market theory that keeps you in or out of a trade. You go with the flow, baby!
Case in point: Back in December I wrote a blog (www.valuetrend.ca) on potential sectors that investors might look at for tax loss selling purposes. One of the ETFs I mentioned was the broad ranged iShares Emerging Markets ETF (EEM-US). It was in a definitive downtrend, as was the Emerging Markets Bond Index. My, how things can change! As you’ll note on the chart below, which is the iShares EEM equity chart, the Emerging Markets as a collective aren’t submerging any longer. In fact, they are very certainly basing. If you read my book Sideways, which covers my philosophy on formulating a buy/sell discipline, you will note that base patterns can indeed be a wonderful thing. They are an indication that a downtrend is over, and they set the stage for the ideal entry point for opportunistic investors like you and me.
On the EEM chart below, you will note that the current base is capped with a near-termed ceiling of around $41.50—pretty close to where the ETF sits right now. Referring to my book, you will note that a break through that $41.50 base (count 3 days) could prove to be the beginning of a very bullish trend for EEM. Confirmation of the uptrend would come from a break through the 200 day Simple Moving Average (SMA)—and that might not take too long, given its current price point of just over $42. To me, this is a position that is worth watching for that potential entry point.

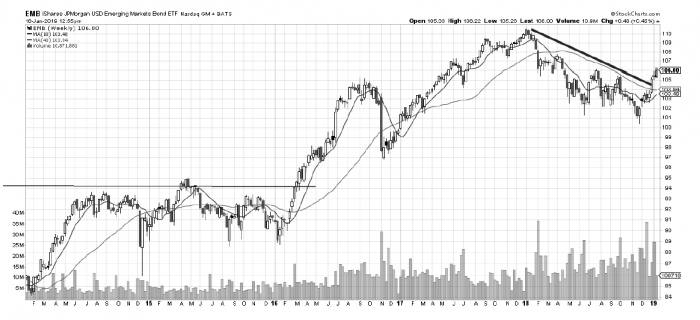
It’s also attractive, having already broken out of its base. In fact, it’s already above the 200 day SMA. If anything, the ETF looks a little overbought at this moment. I’d bet that a short-termed pullback is due on this ETF, which may provide an interesting entry point. Keep an eye open for that potential, too!
I should mention here that before becoming too tempted to consider investing in a broad emerging markets play via an ETF like the iShares “EEM” ETF mentioned above, it’s important to realize that emerging market ETFs are not like buying a traditional sector ETF. Sector ETFs, such as Canadian banks or U.S. consumer discretionary stocks, hold stocks that are in the same industry. Stocks within a given industry tend to display some commonalities in cyclical patterns and business growth. In sector plays, most of the components of the sector move roughly in tandem. So it’s easier to make predictions based on a chart of, say, the US regional banks ETF, or any other sector-focused ETF. Making broad predictions based on the myriad of price patterns seen within the many indices making up an emerging markets ETF is more difficult.
The indices of emerging markets are as wide in chart patterns and trends as you could imagine. An emerging markets ETF is comprised of many completely different country indices. Compare the charts of just three of these indices: China, Russia and India. You will see almost no commonality in price behavior between these three indices. Thus, the broad emerging markets ETFs have to be examined closely for their individual components, and their weightings, before investing in them. And yes, there are many different emerging markets ETFs with considerably different country weightings and profiles.
The profile of the iShares Emerging Markets ETF (EEM) mentioned above is weighted 50% in China, South Korea, and Taiwan, for example. So you have to watch their markets a little closer than say, Mexico or Indonesia—both of which are contained to less than 3% of the index. Meanwhile, the Schwab Emerging Markets ETF (SCHE-US) is heavier in India and Brazil—at 10% and 9% respectively, and much lighter in South Korea. In other words, choose the emerging markets ETF with the weighting that appears most beneficial at the time of your decision, rather than believing that they are all more or less the same.
Keith Richards is President and Chief Portfolio Manager of ValueTrend Wealth Management. He can be contacted at krichards@valuetrend.ca. He may hold positions in the securities mentioned. The information provided is general in nature and does not represent investment advice. It is subject to change without notice. It may also contain projections or other “forward-looking statements.” There is significant risk that forward-looking statements will not prove to be accurate and actual results, performance, or achievements could differ materially from any future results, performance, or achievements that may be expressed or implied by such forward-looking statements and you will not unduly rely on such forward-looking statements. Every effort has been made to compile this material from reliable sources; however, no warranty can be made as to its accuracy or completeness. Before acting on any of the above, please consult an appropriate professional regarding your particular circumstances.