Will That Be "Buy", "Sell" Or "Hold"?
 When it applies to professional or private investing, I have learned from experience that it is one thing to know the path and quite another thing to walk the path. In other words, there is a difference between hypothetical investing and real money investing.
Knowing The Path:
For example, the stated objectives of the $480 million actively managed RBC O'Shaughnessy International Equity fund are: “To provide a long-term total return, consisting of capital growth and current income by investing primarily in equity securities outside of North America based on Strategy Indexing, a rigorous and disciplined approach to stock selection based on characteristics associated with above average returns over long periods of time.”
International equity investing means investing in any region or country to exclude North America and so the relevant benchmark is the MSCI EAFE (Europe, Australia and the Far East) index expressed in Canadian dollars.
Strategy Indexing is a discipline developed by James O'Shaughnessy, a formidable cruncher of historical market data. His Connecticut-based O’Shaughnessy Asset Management is currently a sub-advisor on seven Royal Bank of Canada O’Shaughnessy mutual funds.
 O'Shaughnessy knew the path because years of back-testing on Strategy Indexing produced better long-term returns over a buy-and-hold indexing strategy.
Walking The Path:
The problem is that, when RBC and O'Shaughnessy applied the Strategy Indexing model to real money (walking the path), their International Equity fund as of October 2015 under-performed the EAFE benchmark over the last 1-year, 5-year and 10-year periods.
In fairness to O'Shaughnessy, that MER of 2.25% was a significant drag on returns – which is a problem for most actively managed mutual funds.
The unique feature of O'Shaughnessy’s Strategy Indexing model is the hybrid structure which is based on a blend of both fundamental and technical analysis
The fundamental analyst will study a company’s quarterly financial statements which display items such as revenue, profits, assets and liabilities. The fundamental analyst will also use the financial statements to gain insight on a company's future performance. Earnings momentum is a component of the O'Shaughnessy Strategy Indexing model.
The technical analyst will use studies such as price, volume and relative performance to gain insight on a company's future performance. Price momentum is a component of the O'Shaughnessy Strategy Indexing model
I walked the path from February 2010 to February 2012 when I was a sub-advisor to the $44 million Union Securities Hybrid Investment Program which was a discretionary equity only service using both “fundamental” and “technical” analytical tools to construct the portfolio.
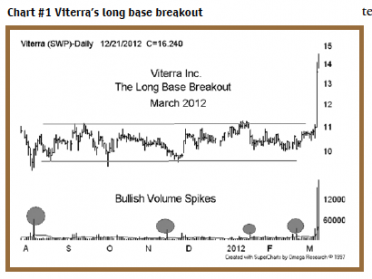
The fundamental analyst (let’s call him George) was a value investor who only bought “cheap” stocks. Most of my technical selections were based on long bases accompanied by bullish volume spikes.
The program was simple in structure. George and I would each select at least ten stocks or ETFs. Each selection would be about a 3% weight which would increase if George and I selected the same stock or ETF. We also believed the risk or volatility of the Hybrid portfolio would be reduced due to the blending of fundamental and technical analysis.
The program was to be fully invested with no market timing. There would be quarterly rebalancing and any component sold by George or me had to be either replaced or the proceeds used to boost an under-weight component.
Over the same 24-month period the Hybrid Program enjoyed five technical selections that were the subject of takeover speculation or bids—namely, Gerdau Ameristeel, El Paso Corp, Biovail Corp. Viterra Inc. and ShawCor Ltd.
Over the same period, George had no selections that were subject to takeover speculation or takeover bids.
When one walks the path or engages in real money investing, one soon learns that stocks can trend up, down or sideways for months and even years.
For example, Canada’s premier energy company Suncor Energy Inc (TSX-SU) at $37 is virtually at the same price level as ten years ago. Conversely, Canada’s specialty packaging company CCL Industries Inc. (TSX-CCL.B) at $207 is well above the $28 price of ten years ago.
I tested this trend tendency by tracking the performance of the Hybrid portfolio beginning with all the fundamental and technical selections held at November 9, 2011 and hypothetically held through to November 12, 2013.
Over the same time period our benchmark TSX Composite Index had a two-year capital return of +9%.
Over the same time period there were twelve fundamental selections that as a group had a negative capital return of -8 %. There were 15 technical selections that as a group had a positive capital return of + 32%.
Our fundamental guy – George—had two problems that seem to be common in many fundamental methodologies. He was drawn into value traps and he clung to the stubborn belief that gold stocks were a natural portfolio hedge.
George took huge losses in Research In Motion Limited (BlackBerry Limited) and three gold miners.
I kept the technical work simple by embracing the tools of “old” technical analysis as opposed to “new” technical analysis.
"Old and New" Technical Analysis:
There is quite a difference between the two and as a long-time active participant, I describe old technical analysis to be all materials and knowledge, such as books, charts and research reports generated before 1985 (the Internet and the personal computer) and new technical analysis to be all materials and knowledge generated after 1985.
In the days before computers and the Internet, we subscribed to weekly and monthly chart book services. We studied books such as the 1958 fourth edition of Technical Analysis Of Stock Trends, by Robert D. Edwards and John Magee, which focused on pattern recognition, trends and volume.
The first technical superstar was Joseph Grandville who, in his 1963 classic book Granville's New Key to Stock Market Profits, introduced on-balance volume (OBV), a momentum indicator that measures positive and negative volume flow. It was Granville who proclaimed “volume precedes price and price precedes fundamentals” – a technical argument still embraced by us older guys.
I still review my 1978 classic publication of Elliott Wave Principle by Frost and Prechter.
My problem with new or “modern” technical analysis is that thanks to the Internet and social media, there are simply too many technical studies for the average investor to wade through.
Most of the popular charting websites offer free charts and the choice at least 50 technical studies or indicators. I use two PC-based charting programs, each offering over 150 built-in indicators and line studies, most of which are squiggly line studies that I never use.
I am an active member of the Canadian Society of Technical Analysts (CSTA) whose mission is “To promote Technical Analysis at both academic and professional levels, through education and the sharing of knowledge with the community of technical analysts and the investment industry, and through the establishment and fostering of the highest standards.”
At a recent CSTA 2015 Annual Conference, there was a guest speaker who presented several new market timing indicators, including the following: Sequential, Combo, Setup, Setup Trend (TDST), Countdown, Range Expansion Index, D-Wave and TD Lines,
The guest lost me at “new” – to me it was simply more squiggly line studies that I would never understand or use.
My technical work is based on a few old studies such as trend lines, relative performance, on-balance-volume and Elliott Wave.
All you need for trend lines is a bar chart (weekly bars preferred), a pencil and a straight edge. In an up-trend, you join at least three significant lows and in a down-trend, you join at least three significant highs.
To study relative performance, you need to compare your investment selections (X) to something else (Y) – be it a sector peer or a relevant index. Your visual study line—or spread—would be (X/Y) or (X-Y).
On-balance-volume (or OBV) is an old money flow study still in use today. Your visual study line is the running cumulative volume that adds a period's volume when the close is up and subtracts the period's volume when the close is down. The OBV line will often lead the price direction.
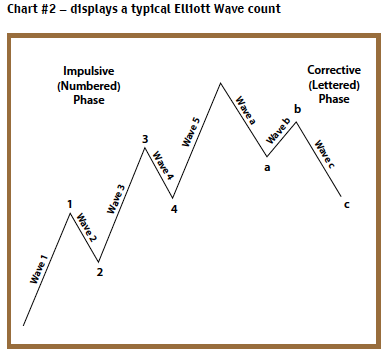
 Elliott Wave is basically an extension of one tenant of Dow Theory and the three phases of a bull market. According to Charles Dow, the first advance is the accumulation phase—often thought to be a bear market rally. The second phase is the recognition phase where there is broad leadership and participation, and finally the third and final speculation phase which is usually accompanied by thinning leadership.
In the 1930s, Ralph Nelson Elliott discovered that stock market prices trend and reverse in recognizable patterns
Basically a bull phase would have five waves (impulse or numbered phase) and a bear phase would have three waves (corrective or lettered phase)—for a total wave count of eight.
When the pattern is completed it is repeated but not necessarily in time or price magnitude.
Walking The Path With Elliott Wave:
During the latter stages of a long bull market, investors can get confused and begin to engage in market timing or over-trading. The best approach would be to understand the longer term structure of the great 2009 – 2016 advance in the major global stock markets. If we apply long-term analysis to an important bellwether, we can better identify our current location within the great 2009 – 2016 advance.
Berkshire Hathaway Inc. Cl B (BRK.B) is a bellwether conglomerate-holding company owning subsidiaries engaged in a number of business activities, and is basically a proxy for the world’s largest economy.
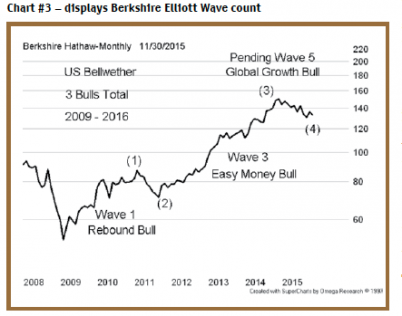
 Our long term plot of BRK.B displays the Elliott Wave structure of the great advance that began from the lows of 2009
Elliott Wave #1
The first bull cycle (1) originated from the lows of 2009 and peaked in early 2011. This was a rebound bull that typically occurs after a crisis bear such as the 2007-2008 global financial crisis which was initially thought to be a bear market rally.
Elliott Wave #2
A short corrective wave that troughs in late 2011 – always higher than the low of 2009.
Elliott Wave #3
The second bull cycle that originated from the lows of late 2011 and peaking in late 2014 –this bull was powered by the easy money policies of the major central banks. An Elliott Wave #3 is usually the longest advance and has broad participation as a rising tide lifts all boats.
Elliott Wave #4
A second corrective wave is usually longer and more complex than the first corrective wave. Investors turn fearful and begin to sell their winners. The trough can never enter the space of the first Elliott Wave #1 advance.
Elliott Wave #5
If we get a typical Elliott Wave count, then a third advance or wave #5 should follow the current 2015 bear in Berkshire and persist through 2016.
The 2016 Outlook:
A final Elliott Wave could be powered by a perception of global growth. Wave #5 advances or up-legs are typically high risk – unlike the prior two advances. They tend to have thin leadership and can be of less price magnitude than the first two advances.
Also what worked in the prior wave #3 advance (consumer & health care) may not work in the final advance. Conversely the losers in the prior wave #3 (advance, energy and materials) may outperform through 2016.
So now we know the path, I suggest we walk the path with caution.
Bill Carrigan, CIM is an independent stock-market analyst. He can be reached at: info@gettingtechnical.com.

