Tools For The Commodity Investor
 Investors often stay too long with a stock or sector when the evidence suggests that the tide has turned. This is one of those factors that I continue to see in my 30 plus years as a broker and now as an analyst.
The reasons are many:
- The expectation that the stock /sector will turn around, soon.
- Ego. The investor cannot believe that they made the wrong choice.
- The market will recognize eventually that this stock/sector offers good value.
- The position in the stock/sector is not that big. The investor can simple wait until the position turns around (this is a combination of 1, 2 and 3.)
Commodity investors, I have found, are some of the worst culprits for hanging on to a position long after the trend has changed from up to down. Perhaps it is a “Canadian thing” to always have at least one foot in the natural resources pool.
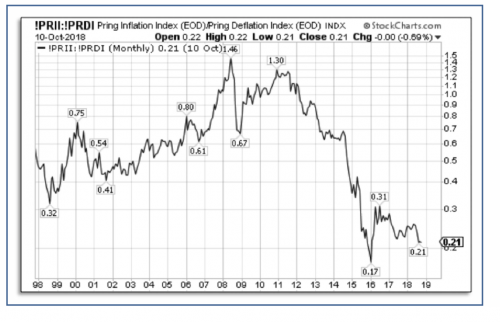
Some of the basic factors that need to advance before commodity prices can rise are increasing demand and stable or decreasing supply, a general strengthening in U.S. Treasury bond prices, inflationary pressures, and perhaps most important, a weak or downtrend in the U.S. dollar.


The first factor is often difficult to quantify. Commodities are a global asset and greater demand in one section of the world (e.g. China) may be neutralized by more supply coming from another region (e.g. U.S. or Canada.) Oil prices are a prime example of this.
The third and fourth factors (inflationary pressures and the U.S. dollar) are easier to measure and quantify.
The movement of the U.S. Dollar Index (DXY) is a critical indicator of any long-term trend in natural resources. As commodities are priced in U.S. dollars, the higher the dollar climbs the less attractive commodities become when they must be purchased in other currencies.
Right now, the dollar has the wind at its back with a strong economy (rising Gross Domestic Product) record low unemployment (about 3.8%) and more interest rate increases on the way in 2019. The chart below shows the impact of an escalating dollar on the Commodity Research Bureau (CRB).
The U.S. dollar index peaked at $122.50 in early 2002. At the same time, the CRB was at one of its low points at 185.66. As the dollar crashed over the next six years, commodity prices soared. The CRB went from up over 250% from 185.66 to 462.74. However, as the “Big dollar” started to bottom out and form a base in 2008 and 2009, the CRB’s ascent began to falter. A reverse of trend occurred for both assets between 2009 and 2012 and is continuing to present date.
Bottom Line:
For those investors who must have some commodities-based securities in their portfolios, those investors should focus, not just on the short-term supply /demand fundamentals, but also on the longer term guiding factors such as inflation or deflation. Which group has the greatest relative strength? And most importantly, what is the U.S. dollar doing. A quick review of the Federal Reserve’s interest rate strategy over the next six to 12 months plus the dollar’s overall trend will provide more information that is valuable than any annual report.
Two very useful websites for this information (and a whole lot more) are Stockcharts.com and tradingeconomics.com.
Donald W. Dony, FCSI, MFTA. Analyst, past instructor for the Canadian Securities Institute (CSI), editor for the www.technicalspeculator.com, dwdony@shaw.ca.


