Creating An Investment Process - Part 1
 In this and the next issue of MoneySaver, I would like to assist readers in creating their own disciplined trading system. Please keep in mind that I can only give you a basic working knowledge of the steps necessary to trade effectively. It would require a substantial amount of verbiage to cover an entire trading system in detail. Further, I would not expect a retail investor (aka a “do-it-yourself investor”) to possess the more in-depth technical knowledge that trained analysts have. Thus, I am focusing on the most meaningful, pragmatic skills that you might be able to use as an individual investor. If nothing else, this article should serve to assist you in developing your own structured process, even if your analytical skills differ from that of a pro. Here are the steps I will discuss in this article to help you create your own buy/sell discipline:
- Macro market technical analysis
- Initial screening for technically favourable stocks
- Screening for fundamental suitability
- Position size
- Sell discipline
1. Macro Market Technical Analysis
I believe that a blanket “buy-and-hold-at-all-costs” mentality is actually a riskier and more costly strategy than a carefully planned system of buying and selling assets. Many investors have been led to believe that they must be fully invested through good times and bad. My objection to this belief is that, at times, stock markets can exhibit signs of having a higher level of risk-versus-reward potential. If you are uncomfortable with investing when risk outweighs return, you must have a way to identify that potential.
To understand the basics of macro technical analysis, I’ll borrow from my book Sideways, Understanding the Power of Technical Analysis.
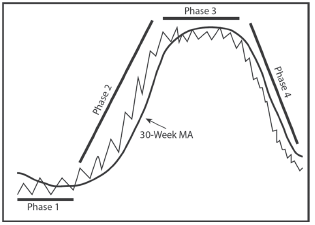
In my book, I describe the four phases of the stock market. These phases occur over both long and short time scales. It is key that you identify the current phase of the market to be able to trade profitably. The chart I’ve attached below will help you do this.
Phase 1. The market is changing from a downtrend to an eventual uptrend during phase 1. For this reason, I call it the “basing” phase.
Phase 2. The market is in an uptrend during phase 2. Obviously, it pays to be long the market during this phase. Conversely, during phase 4 the market is in a downtrend.
Phase 3. This is the topping phase. Here the market transitions out of a bull market (uptrend) and reverses direction into a new bear market (downtrend).
Phase 4. Being out or short are the only tactics to consider during phase 4. You can use a moving average, like the 30-week line used on my chart on this page to help you determine the current phase. A 40-week line, which translates to a 200-day line, can help filter your strategy to further reduce false signals. Experiment to see which works best for you.
It’s particularly important to be able to identify the basing or topping phases of the market. Failure to do so results in missed opportunities (basing phase) or avoidable losses (topping phase).
If you believe that the market is about to enter into a “Phase 4 Downtrend”,  you should raise cash in your equity holdings. The amount of cash depends on how severe you think the correction will be. Your decision is based upon the significance of the topping pattern – that is, if the “Phase 2 Top” appeared on a monthly chart, prepare to raise more cash than you would if the top occurred on a daily chart. You should determine how much cash you will raise in the event of a more significant market breakdown – which may be defined as a break of the 30-week (or 40-week) moving average followed by the break below the last low (trough) point on the chart. In such a case, I will go as high as 50% cash in the portfolio. Conversely, a lesser top might only inspire me to raise only 10-20% cash.
I’m also a believer in seasonal tendencies. As a rule of thumb, I always raise a bit of cash every April or May. If the market is clearly entrenched in a “Phase 2 bull market”, I won’t raise much more than 15% cash within the portfolio. If the market is looking choppy and ready for a phase transition, I’ll raise much more cash in the spring. The reasoning behind sticking to the seasonal discipline is simple: over time, the strategy has vastly outperformed buy-and-hold index investing by a magnitude of order. Thackray’s Guide tells us that $10,000 invested in 1950 only during the “bad” six months (May – November) actually lost about $3000 to 2013. Your $10,000 invested was worth less than $7000 after 63 years of investing. Conversely, $10,000 invested every November and sold every May grew by some $1.2 million dollars. It’s obvious that this strategy is worthy of our attention.
Finally, individual stock beta can be adjusted within the portfolio according to the broader market outlook. Beta is a measurement of how much the market might move a given stock up or down. Higher beta is desirable in a bull market, while lower beta is desirable under bear conditions when the outlook is for higher risk potential. When I look to sell stocks based on my macro-market outlook, the higher beta stocks are always the first to go.
2. Initial Screening For Technically Favourable Stocks
When searching for stocks with favourable technical profiles, I begin by searching for stocks either breaking out of a “Phase 1 base” or stocks that are successfully testing an established “Phase 2 up trend”.
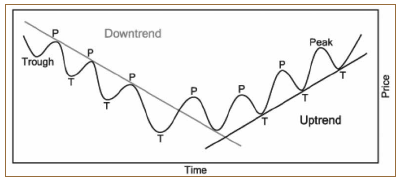
To buy a stock when it’s in an uptrend, you will want to look for a pullback to the trendline to optimize your entry price. Conversely, avoid stocks that are trending down. As simple as that sounds, you would be amazed as to how many investors think they can time the bottom in a downtrend. You cannot do this with any level of consistency – please avoid down-trending stocks! Instead, wait until they form a phase 1 base and breakout, as described above. As mentioned above, a 40-week moving average line, which translates to a 200-day line, can help identify a trending stock. If the stock is not consistently staying above this line, it’s not in a long-termed uptrend. Three successively rising troughs and peaks confirm an uptrend. Below is a chart of an uptrend and a downtrend—with a trendline drawn along the rising troughs during the uptrend phase. Buy when the stock hits the trendline and successfully rallies. Note that a downtrend is identified through falling peaks – where we’ve drawn the declining trendline.
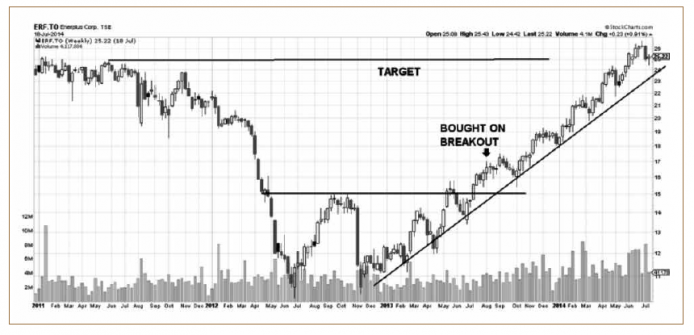
A breakout from a base (sideways pattern where the market is not making new highs or lower lows) is the single most lucrative way to buy stocks, in my opinion. You are catching the emergence of a new uptrend at the early point of the move. The main things I look for are: a breakout through the established overhead resistance and a spike of volume to help with that breakout. These factors can be seen on the graph of Enerplus (ERF-TSX) above. Note how after the stock broke out in early 2013 it entered into an uptrend. We looked to its prior resistance point of around $24 as our target price. We bought on the breakout.

I will continue helping you create your own disciplined trading system in the next issue of Canadian MoneySaver.
Keith Richards, Portfolio Manager, can be contacted at krichards@valuetrend.ca. He may hold positions in the securities mentioned. Worldsource Securities Inc. – Member: Canadian Investor Protection Fund, and sponsoring investment dealer of Keith Richards.
The opinions expressed are those solely of Keith Richards and may not necessarily reflect that of Worldsource Securities, its employees or affiliates. The contents are for information purposes only and do not represent investment advice.


